Field Research and Quantitative Analysis of Geoscientific Data by Princeton
By Dr. Frederik J. Simons, Princeton University
For students who arrive at Princeton expecting their courses to be heavily dependent on textbook learning, the Freshman Seminar Earth’s Changing Surface and Climate is a welcome surprise. Professor Adam Maloof and I give students practical experience in geological and geophysical research. Our approach is rooted in the conviction that anyone with a basic curiosity can ask scientifically interesting questions. Moreover, with the right tools and advice, students can be scientists from the minute they walk into the lab.
Equipped with GPS receivers, two weather stations, a gravimeter, and a total station (an electronic instrument that uses a laser to build 3D maps of the local terrain), students engage in quantitative analysis of observable phenomena such as topography, gravity, and weather. Using MATLAB®, they fit surfaces to the data, perform regressions, plot maps, and find correlations. The highlight of the course is a weeklong field trip during Fall break. We travel to geographically interesting locales in California and elsewhere to gather data. Students later analyze the data in MATLAB to answer scientific questions that, in many cases, have not been asked, or answered, before.
Choosing Scientific Data Analysis Software
As first-semester freshmen, few of the students have used any software other than spreadsheets to manipulate numerical data. I explain that spreadsheets are generally less efficient than MATLAB and cannot perform the kind of data processing needed in the seminar. MATLAB is easy to learn and use, but at the same time, it scales to research-grade applications. (I use MATLAB and many toolboxes extensively in my own research.) Since Princeton acquired a Total Academic Headcount license, MathWorks products are being incorporated more widely into the university curricula. As a result, familiarity with MATLAB is increasingly becoming a prerequisite. For example, in my courses Global Geophysics and Data, Models and Uncertainty in the Natural Sciences I expect the students to know (or be very quick at picking up) MATLAB.
Course Structure
The seminar is partitioned into three segments. Students spend the first part of the semester learning to operate and analyze data from the devices and instruments that they’ll use in the field. Next comes the field trip. The final part of the course is devoted to analyzing data from the trip and completing research projects.
The course meets once a week for three hours. The first hour or so is spent in lecture, in which Professor Maloof or I cover the concepts behind the week’s topic. For example, I might talk about terrestrial and planetary topography and then explain how to create a digital topographical map (here, Mapping Toolbox™ comes in handy). The remaining two hours are more interactive. I usually have MATLAB running so that I can show, for example, how to fit curves, make maps, and plot data.
Between classes the students collect data from around campus. These data-gathering projects have included using GPS to map the campus, measuring the diameters of trees to estimate biomass in the region, and testing the precision and accuracy of a handheld GPS device by comparing readings taken several days in a row at the same landmarks. Over the following week, the students use MATLAB and Statistics and Machine Learning Toolbox™ to analyze their data, produce histograms and plots, and answer questions on statistics, uncertainty, and repeatability.
As another example, when we study gravity, the students learn how Earth’s gravitational field varies as a function of height and location. Using a gravimeter, they measure the gravitational force at different altitudes in a 20-story building on campus. They see Newton’s law of universal gravitation in action when they plot and regress their data in MATLAB and observe the 1/r2 fall-off of gravity as they ascend from floor to floor.
Collecting and Analyzing Field Data
For most students, the Fall break trip is the most exciting and memorable part of the course. In past years we’ve travelled to California— Long Valley Caldera, Death Valley, Owens Valley, and Horseshoe Lake—to study historical climate change, wind ripple patterns in dunes, or fault scarps at the site of the 1872 Lone Pine earthquake, one of the largest on record in California.
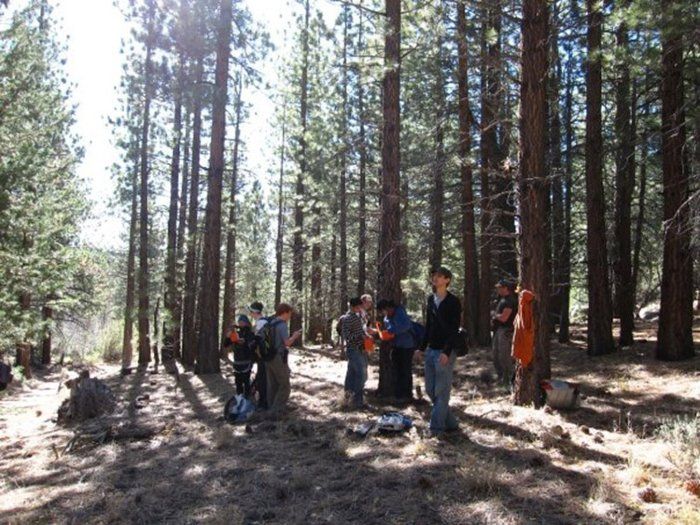
Students are divided into four-person teams. Each team develops its own research question. As we move from site to site, teams take turns directing the data-gathering effort. For example, for the first day-and-ahalf, the Tree Team will get help from everyone in the class in taking core samples (Figure 1). Later, everyone helps the Fault Team as they use a total station to map the fault line scarp. Students also collect rock samples for thin-section analysis, measure tree diameters, and continuously record GPS data, which is later used to construct a digital elevation model of the location in MATLAB.
After an intense week of 12-hour days in the field, the students return to Princeton with a vast amount of data to process. In the remaining weeks they analyze their observations, prepare and deliver a class presentation on their findings, and work on their final papers.
Many of these final papers are based on data collected in the field. For one project, for example, the team analyzed more than 80 tree core samples to correlate historical rainfall, humidity, and temperature records going back decades with growth rates indicated by the width of the rings.
After scanning the core to create a high-resolution color image, the students measured summer and winter ring widths in individual years. Hand-processed data sequences serve as training sets for automated analysis with Image Processing Toolbox™. After that, they perform correlation, time-series, and regression analysis in MATLAB (Figures 2 and 3). Professional scientists use this same approach to reconstruct climate variations over the last several thousand years.


The students then write research reports and develop class presentations. The MATLAB maps, histograms, rose diagrams, and scatter plots in these reports and presentations help the other students understand the data and provide a basis for the scientific conclusions reached by each team.
Empowering Students to Tackle Real Scientific Questions
Traditional introductory geology courses rely on qualitative analysis of visual patterns; for example, students might be asked to look at a contour map and draw conclusions based on what they see. Technology has advanced dramatically since those textbooks were written, and today, even mapping is a digital, quantitative mathematical science. Our seminar takes advantage of those advances to help students experience science as an activity that they can engage in, not just a topic to read about.
Students tell me that they find the course empowering because it teaches them to use scientific instruments and MATLAB to answer genuine research questions. I know that they’ll use the data analysis skills they learn in this Freshman Seminar in virtually any major they choose. I also know that when they move beyond Princeton into any field that requires data analysis or programming, MATLAB will be on their desktops.
Published 2010 - 91878v00