Reconstructing a 3D Image of an Operating Li-Ion Battery Using Neutron Computed Tomography
By Elmar Tarajan, MathWorks, and Anatoliy Senyshyn, Technische Universität München
When compared with nickel-cadmium (NiCd), nickel–metal hydride (NiMH), and other more traditional technologies for electrochemical energy storage, lithium ion (Li-ion) batteries offer numerous advantages, including high energy and power densities, a weak memory effect, and slow self-discharge. These advantages make Li-ion batteries well-suited to a wide range of applications, including portable electronics, hybrid and electric vehicles, and stationary storage for renewable energy. Yet Li-ion technology is not without its drawbacks: Li-ion batteries have limited cycle and calendar life, and they have a narrower temperature range of stable operation.
Though researchers are actively working on addressing Li-ion technology weaknesses, their efforts are limited by the inability to directly observe the complex processes that take place within Li-ion batteries in operation. Modern Li-ion batteries are isolated electrochemical systems, and as soon as they are opened for inspection, their internal state changes.
To address this issue, researchers have turned to neutron tomography to create three-dimensional (3D) images of Li-ion batteries [1]. The 3D image is reconstructed from a series of 2D images captured via neutron radiography, a nondestructive imaging technique that uses neutrons instead of X-rays as the radiation source. In this article, we describe the process of assembling a 3D image of a Li-ion battery from hundreds of 2D radiographic projections. We use MATLAB® and Image Processing Toolbox™ to load the 2D projection image files, remove noise, calculate the center of rotation for each projection, and perform an inverse Radon transform to reconstruct a 3D image from the projection data.
Neutron Radiography and Tomography Basics
Standard magnetic resonance imaging and traditional X-ray imaging are poorly suited to Li-ion battery research because either these technologies are incompatible with the transition metals found in the batteries or they cannot accurately localize lithium, hydrogen, and oxygen atoms. Neutron radiography, in contrast, is capable of distinguishing not only light and neighboring elements in the periodic table but also different isotopes at penetration depths adequate for battery imaging.
A neutron beam illuminates the battery, and part of the beam is absorbed depending on the shape, density, and isotope composition of the battery (Figure 1). The portion of neutrons that pass through the battery is measured by a 2D detector.

Figure 1. Illustration of a neutron radiograph.
With a sufficient number of projections collected at defined angular positions of the object, a complete 3D distribution of neutron attenuations in the object can be reconstructed using a filtered backprojection algorithm to compute the inverse Radon transform. This technique, neutron tomography, enables researchers to noninvasively create 3D representations of the Li-ion batteries and other opaque objects.
Loading and Preprocessing Source Images
The images we used in developing the MATLAB algorithms for this project resulted from an experiment [1] performed at the ANTARES facility [2] of Heinz Maier-Leibnitz Zentrum near Munich, Germany. A Li-ion cell was irradiated by a polychromatic neutron beam while 600 tomographic projections were collected across a complete 360° angular range as the battery was rotated 0.6° for each projection.
The acquisition resulted in a set of 2048 x 2048-pixel TIFF images with 32-bit resolution, labeled to include rotation angle; for example:
  bat_run1__000.000.fits.tif
  bat_run1__000.600.fits.tif
  …
  bat_run1__359.100.fits.tif
  bat_run1__359.700.fits.tif
After loading each image, our first step was to select a region of interest (ROI) surrounding the battery (Figure 2). Narrowing the scope in this way reduced processing time in subsequent steps.
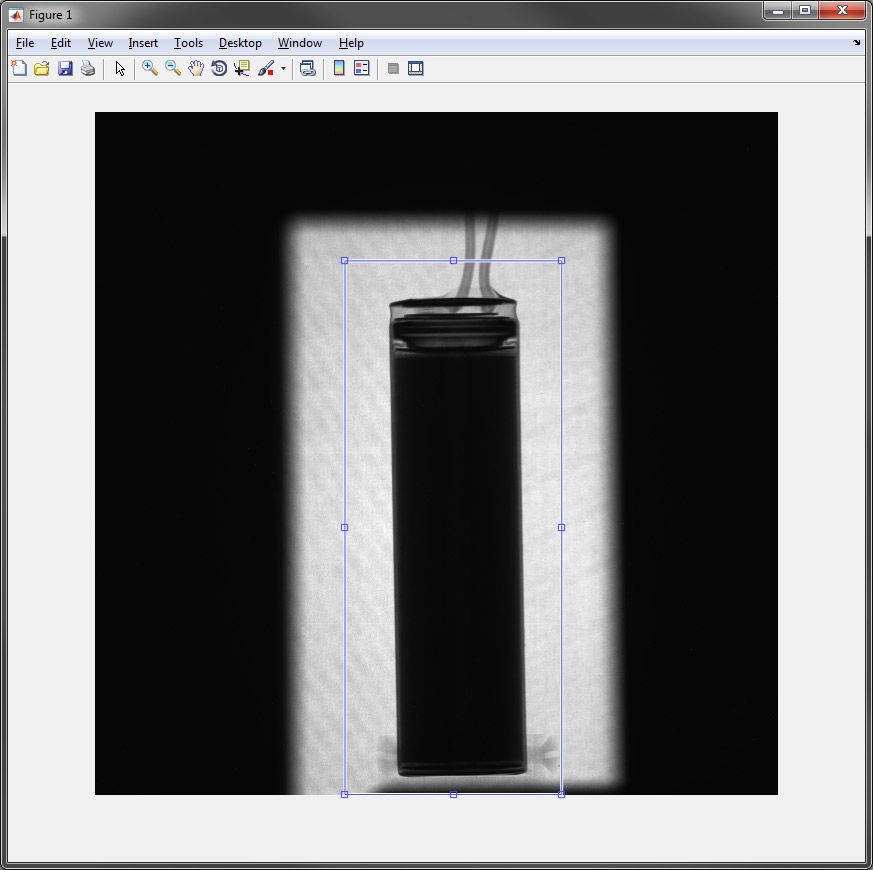
Figure 2. A projection TIFF with a region of interest selected.
The following MATLAB code reads a single file and sets the ROI using the imrect tool, which provides a draggable rectangle in the figure window:
  >> img = imread('bat_run1__000.000.fits.tif');
  >> imshow(img);
  >> h = imrect
  >> roi = wait(h)
  roi =
  750 450 650 1600
Next, we wrote MATLAB code to automate the process of preallocating memory and reading each image file. We extracted the rotation angle for the battery (theta) from each file name:
% Determine all available image files
file = dir('bat_run1__*.tif');

% Preallocate memory
ImageData = zeros(roi(2),roi(1),numel(file));
% Start loop to load images into MATLAB
for N1 = 1:numel(file)
   img = imread(file(N1).name,'PixelRegion',{[roi(2)
   roi(2)+roi(4)] [roi(1) roi(1)+roi(3)]});
   ImageData(:,:,N1) = img;
   theta(N1) = sscanf(file(N1).name,'bat_run1__%g');
end
Correcting for Noise
To improve the accuracy of tomography reconstruction, we had to correct for noise caused by beam and detector nonlinearities in the collected images. To do this, we used two special kinds of reference images created using the experimental setup. The first, which we named OpenBeamData, was created by averaging several images with an open beam (in which no battery was present), resulting in a virtually blank projection. The second, named DarkFieldData, was created by averaging several images with the neutron beam turned off, resulting in a completely dark image (Figure 3).
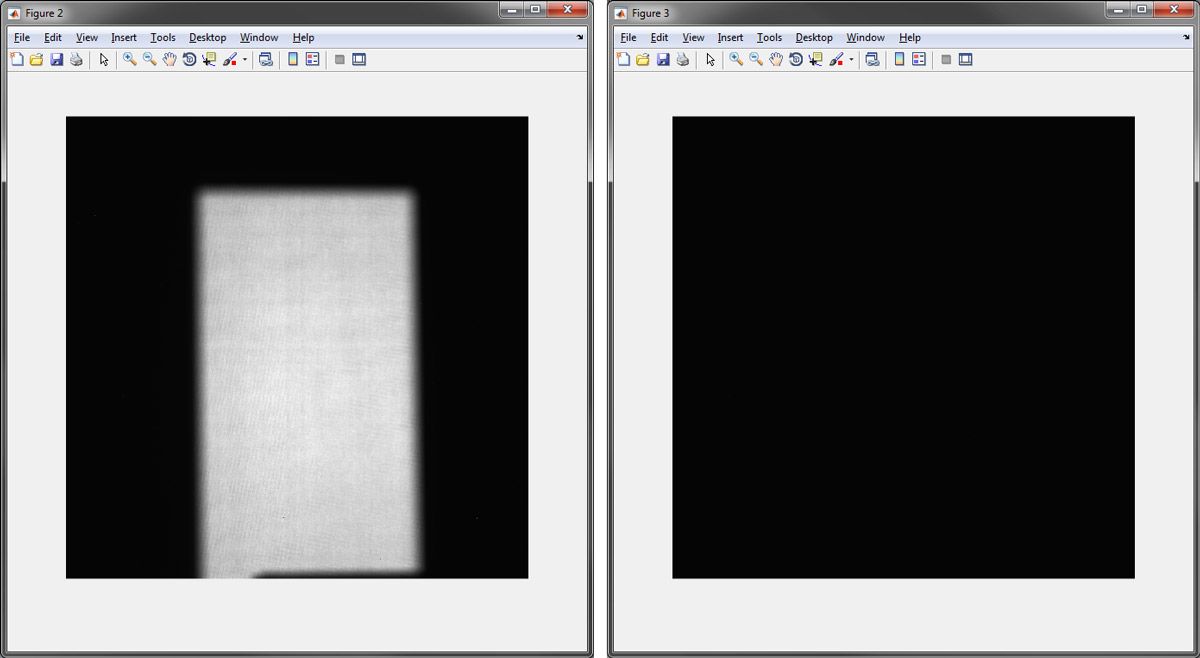
Figure 3: OpenBeamData image (left) and DarkFieldData image (right).
In neutron tomography, the intensity values in each projection image represent the object’s neutron absorption, which is directly related to its density. The neutron absorption \(μd\) is defined as \( μd=- ln(\frac{I}{I_0}) \) where \(I\) and \(I_0\) are the transmitted and open beam at each pixel, respectively. To minimize noise, the dark-frame baseline was subtracted from both the projection and open-beam images. To compensate for nonlinearities, we computed the neutron absorption value for each source image using the following MATLAB loop:
for N1 = 1:numel(file)
   % remove noise
   ImageData(:,:,N1) = -log(ImageData(:,:,N1)-
   DarkFieldData)./(OpenBeamData-DarkFieldData);
end
Calculating the Center of Rotation
In the inverse Radon transform, the object rotation axis must coincide with that of the rotation table. However, because it can be difficult to control the object rotation accurately, we decided to use a rough alignment and correct any offset in the data later with MATLAB code.
A misalignment of the battery is readily apparent in the superposition of two images collected at angles that differ by 180° (Figure 4).
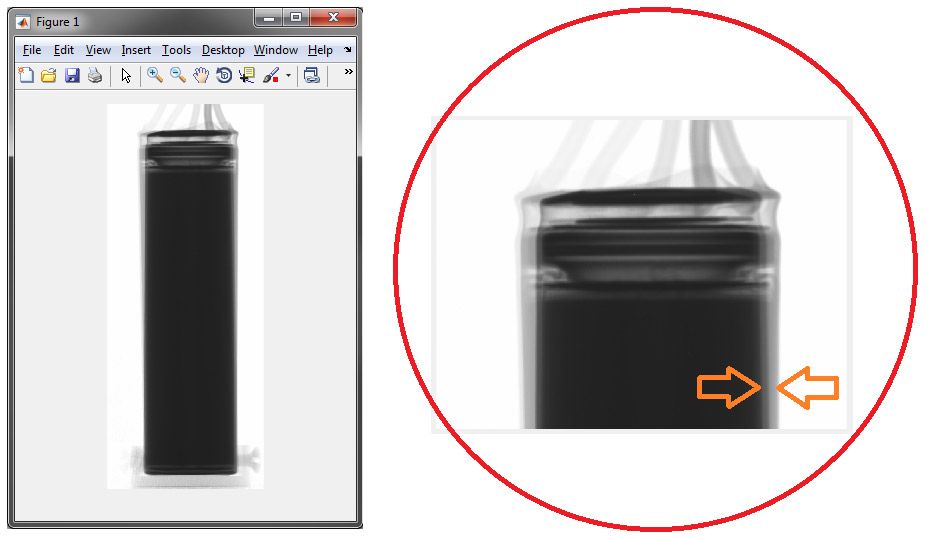
Figure 4. A superposition of two battery projection images collected 180° apart.
To measure the alignment offset, we set up an optimization problem that adjusted the center of rotation to minimize the difference between any two such images:
function offset = DetermineRotationCentre(img1,img2);
offset = fminsearch(@(x) ImageCompare(x,img1,img2),-100);
end

function f = ImageCompare(x,img1,img2)
   f=mean(mean(abs(img1-circshift(fliplr(img2),[0
   round(x)]))));
end
We then applied the offset we calculated to all the collected image data:
>> Offset =
DetermineRotationCentre(ImageData(:,:,1),ImageData(:,:,301
>> ImageData = ImageData(:,Offset:end,:);
Reconstructing the Battery Image from Projection Data
Once the 2D images had been loaded, denoised, and centered, the final step was performing an inverse Radon transform to reconstruct the 3D representation of the battery’s inner structure based on the collected projections. We used the iradon function from Image Processing Toolbox to perform this transform on the projection data and reconstruct the battery layer by layer (Figure 5).
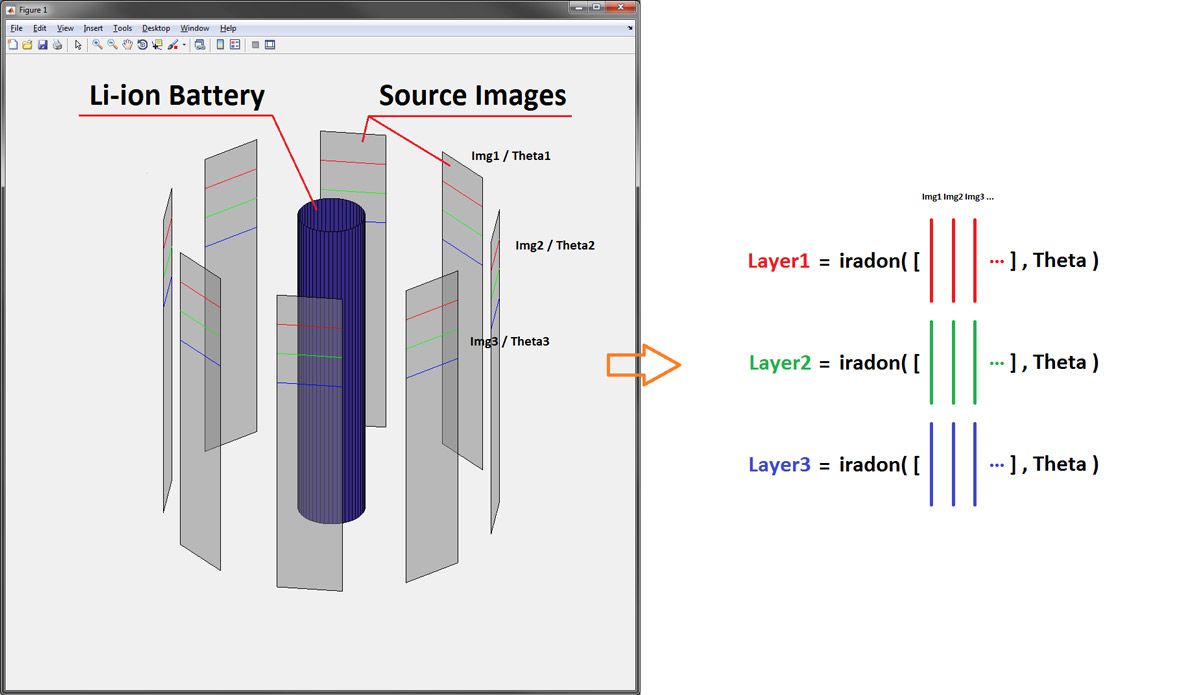
Figure 5. Diagram illustrating the layer-by-layer reconstruction of a 3D representation of the battery from source images.
The MATLAB loop for reconstructing the battery image is straightforward:
for N1 = 1:size(ImageData,1)
  % Use squeeze to remove the singleton dimension because
  iradon expects a 2D-array as an input
    Layer(:,:,N1) = iradon(squeeze(ImageData(N1,:,:)),Theta);
end
Once we had reconstructed the battery image, we used MATLAB to visualize individual cross-sections in detail (Figure 6).

Figure 6. Absorption cross-sections (grayscale coded) of the reconstructed battery. The red lines in the center image highlight the location of the four cross-sections and their corresponding histograms to the left and right.
Using the colormap editor, we interactively applied the color scheme (either grayscale or false colors) to the 32-bit absorption images. Manual adjustment of the color scheme clearly revealed small details, including the battery’s safety vents, center pin, gaskets, microcircuits, and stack of rolled electrodes (Figure 7).
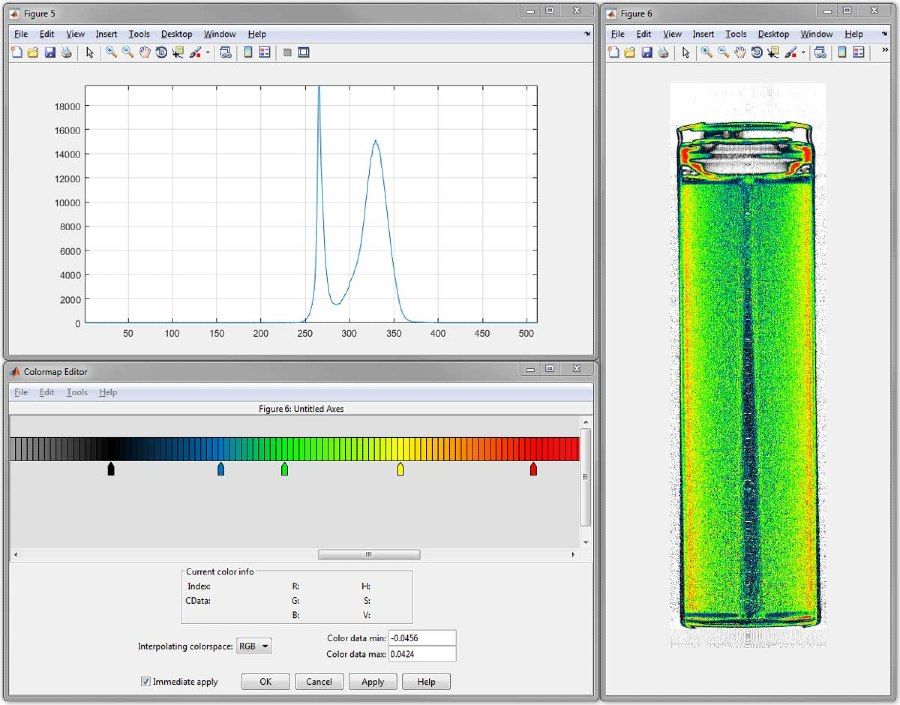
Figure 7. A color image of the battery showing details of its inner structure. Top left: image histogram. Bottom left: false color selector, enabling the choice of color scheme for the visualization of absorption maps.
Conclusions
The reconstruction technique that we implemented in MATLAB provides a nondestructive way to observe the behavior of Li-on batteries operating at various conditions, such as charge rate, temperature, state-of-charge, and state-of-health. All this makes the technique a highly effective diagnostic tool. It is especially well-suited to in situ aging diagnosis, which can be implemented as a part of the quality control in the battery manufacturing process. The MATLAB code we used can be easily extended by implementing more advanced data filtering techniques or creating additional visualizations of the reconstructed 3D image.
Acknowledgments
The experimental part of the project was supported by Deutsche Forschungsgemeinschaft. We acknowledge Heinz Maier-Leibnitz Zentrum for granting access to its experimental infrastructure and Dr. Martin J. Mühlbauer for his assistance with data collection, analysis, and fruitful discussion.
Published 2017 - 93174v00
References
-
A. Senyshyn, M.J. Mühlbauer, K. Nikolowski, T. Pirling, and H. Ehrenberg, "'In-operando' neutron scattering studies on Li-ion batteries," J. Power Sources 203 (2012) 126-129.
-
Heinz Maier-Leibnitz Zentrum (2015), "ANTARES: Cold neutron radiography and tomography facility," Journal of large-scale research facilities, 1, A17. http://jlsrf.org/index.php/lsf/article/view/42