mesh
Mesh properties of metal, dielectric antenna, or array structure
Description
mesh( generates a plot of
meshed antenna, array, custom geometric shape, or a platform. You must run any
analysis (impedance, current, charge, pattern etc.) on the antenna or array
prior to generating the mesh plot. Here, the object)MeshMode is
"auto".
mesh(
generates a plot of meshed antenna, array, custom geometric shape, or a
platform. Here, the object,MaxEdgeLength=Value)MeshMode is "manual"
and you must specify the maximum edge length for the mesh to generate the plot.
You do not need to run any analysis (impedance, current, charge, pattern etc.)
on the antenna or array prior to generating the mesh plot.
mesh(___,
generates a plot of meshed antenna, array, custom geometric shape, or a platform
with additional properties specified using one or more Name-Value Arguments.Name=Value)
Examples
View Mesh Properties of Antenna
Create a top-hat monopole antenna and run impedance analysis on it.
h = monopoleTopHat;
i = impedance(h,75e6)
i = 2.4847e+02 + 5.9963e+02i
VIew the antenna mesh.
mesh(h)
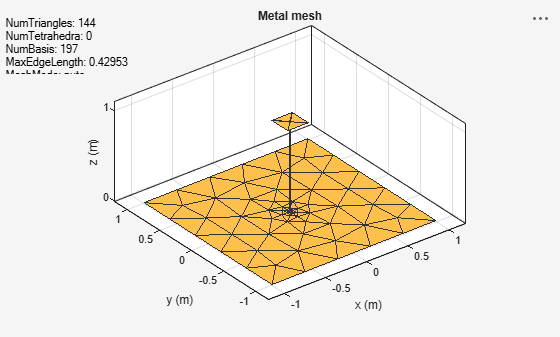
View the mesh properties.
m = mesh(h)
m =
  MeshReader with properties:

                Points: [3x92 double]
             Triangles: [4x144 double]
            Tetrahedra: []
         MaxEdgeLength: 0.4295
         MinEdgeLength: 0.3221
            GrowthRate: 0.9500
    MinimumMeshQuality: 0.0660
              MeshMode: 'auto'
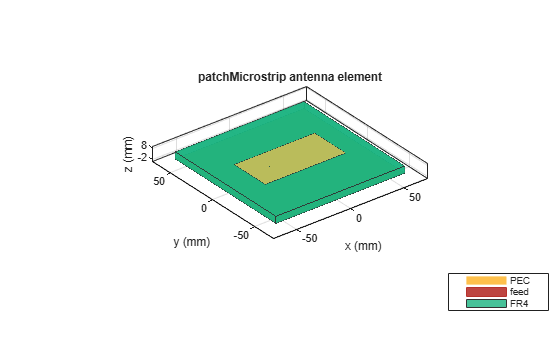
Mesh Microstrip Patch Metal-Dielectric Antenna
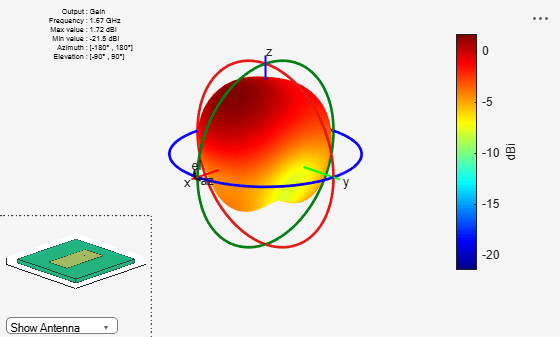
Radiation Pattern of Microstrip Patch Antenna
Create a microstrip patch antenna using 'FR4' as the dielectric substrate.
d = dielectric("FR4");
pm = patchMicrostrip(Length=75e-3,Width=37e-3,...
        GroundPlaneLength=120e-3,GroundPlaneWidth=120e-3,...
        Substrate=d);
show(pm)
Plot the radiation pattern of the antenna at a frequency of 1.67 GHz.
figure
pattern(pm,1.67e9)
Mesh the whole antenna.
figure
mesh(pm)
Mesh only the dielectric surface of the antenna.
figure
mesh(pm,View="dielectric surface")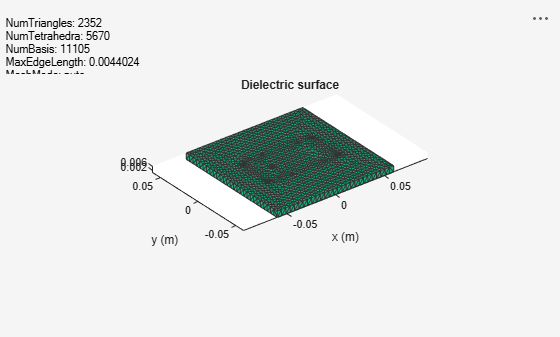
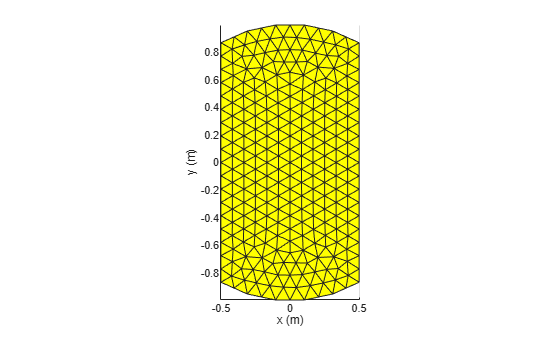
Mesh Arbitrary Shape
Create a rectangular and circular shape, intersect them and mesh at a wavelength of 2 m.
r  = antenna.Rectangle;
c  = antenna.Circle;
p = r&c;
mesh(p,2);
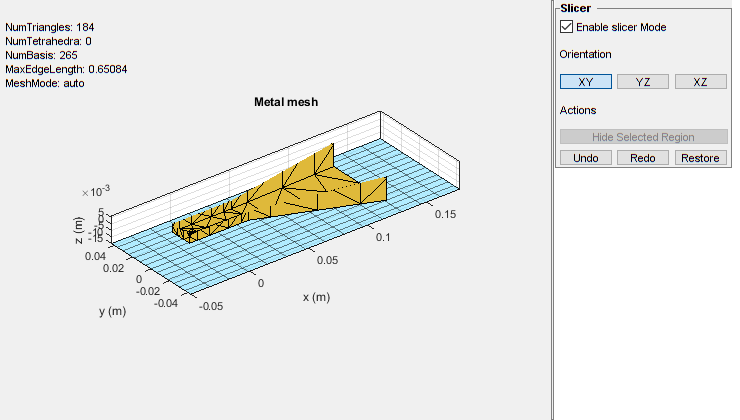
View Sliced Mesh Plot of Antenna
Create a default horn antenna. Mesh the structure with the Slicer argument set to "on".
ant = horn;
z = impedance(ant,70e6);
mesh(ant,Slicer="on")
Select Enable slicer Mode. Then select a plane for the slice under Orientation.
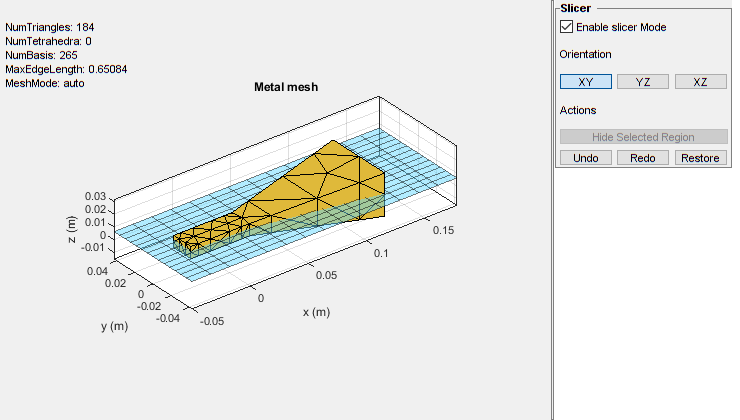
Click on the plot and select a region to hide.

Click Hide Selected Region to view the desired slice.
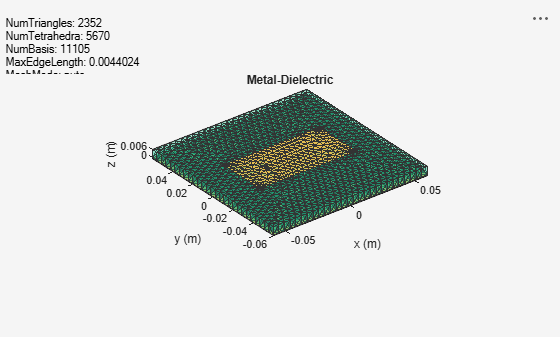
Read Mesh Parameters of Microstrip Patch Antenna
This example shows how to read mesh parameters of a microstrip patch antenna and view the metal, dielectric, and complete mesh.
Create Microstrip Patch Antenna
Create a microstrip patch antenna with copper conductor and FR4 PCB substrate. Run impedance analysis on this antenna at 1.67 GHz to automatically generate the mesh.
p = patchMicrostrip(Conductor=metal("Copper"), Substrate=dielectric("FR4"));
figure
impedance(p,1.67e9);

Read Mesh Parameters of Antenna
Read the mesh parameters such as number of points, triangles, and tetrahedra, maximum and minimum edge length, mesh growth rate, and quality using the MeshReader object.
m = mesh(p)
m =
  MeshReader with properties:

                Points: [3x1644 double]
             Triangles: [4x2014 double]
            Tetrahedra: [4x4620 double]
         MaxEdgeLength: 0.0044
         MinEdgeLength: 2.2012e-04
            GrowthRate: 0.9500
    MinimumMeshQuality: 0.0803
              MeshMode: 'auto'
View Mesh of Antenna
View the metal mesh.
figure
showMetalMesh(m)

View the dielectric surface mesh.
figure
showDielectricSurfaceMesh(m)

View the dielectric volume mesh.
figure
showDielectricVolumeMesh(m)

View the overall mesh.
figure
showMeshAll(m)

Input Arguments
Output Arguments
Version History
Introduced in R2015a
You can also select a web site from the following list:
Americas
- América Latina (Español)
- Canada (English)
- United States (English)
Europe
- Belgium (English)
- Denmark (English)
- Deutschland (Deutsch)
- España (Español)
- Finland (English)
- France (Français)
- Ireland (English)
- Italia (Italiano)
- Luxembourg (English)
- Netherlands (English)
- Norway (English)
- Österreich (Deutsch)
- Portugal (English)
- Sweden (English)
- Switzerland
- United Kingdom (English)