MTFChart
R2026bDescription
Add-On Required: This feature requires the Optical Design and Simulation Library for Image Processing Toolbox add-on.
An MTFChart object plots modulation transfer function (MTF)
curves for one or more MTF result objects.
Use an MTFChart chart to visualize sagittal and tangential contrast
transfer curves for selected wavelengths and field points.
Creation
Create an MTFChart object by using the show object
function of a GeometricMTF or HuygensMTF object. Create an
MTF result object by using the mtf object
function.
hmtf = show(mtfr)
You can specify chart properties when you call show.
hmtf = show(mtfr,WavelengthIndices=[1 3],Grid="major")Properties
Examples
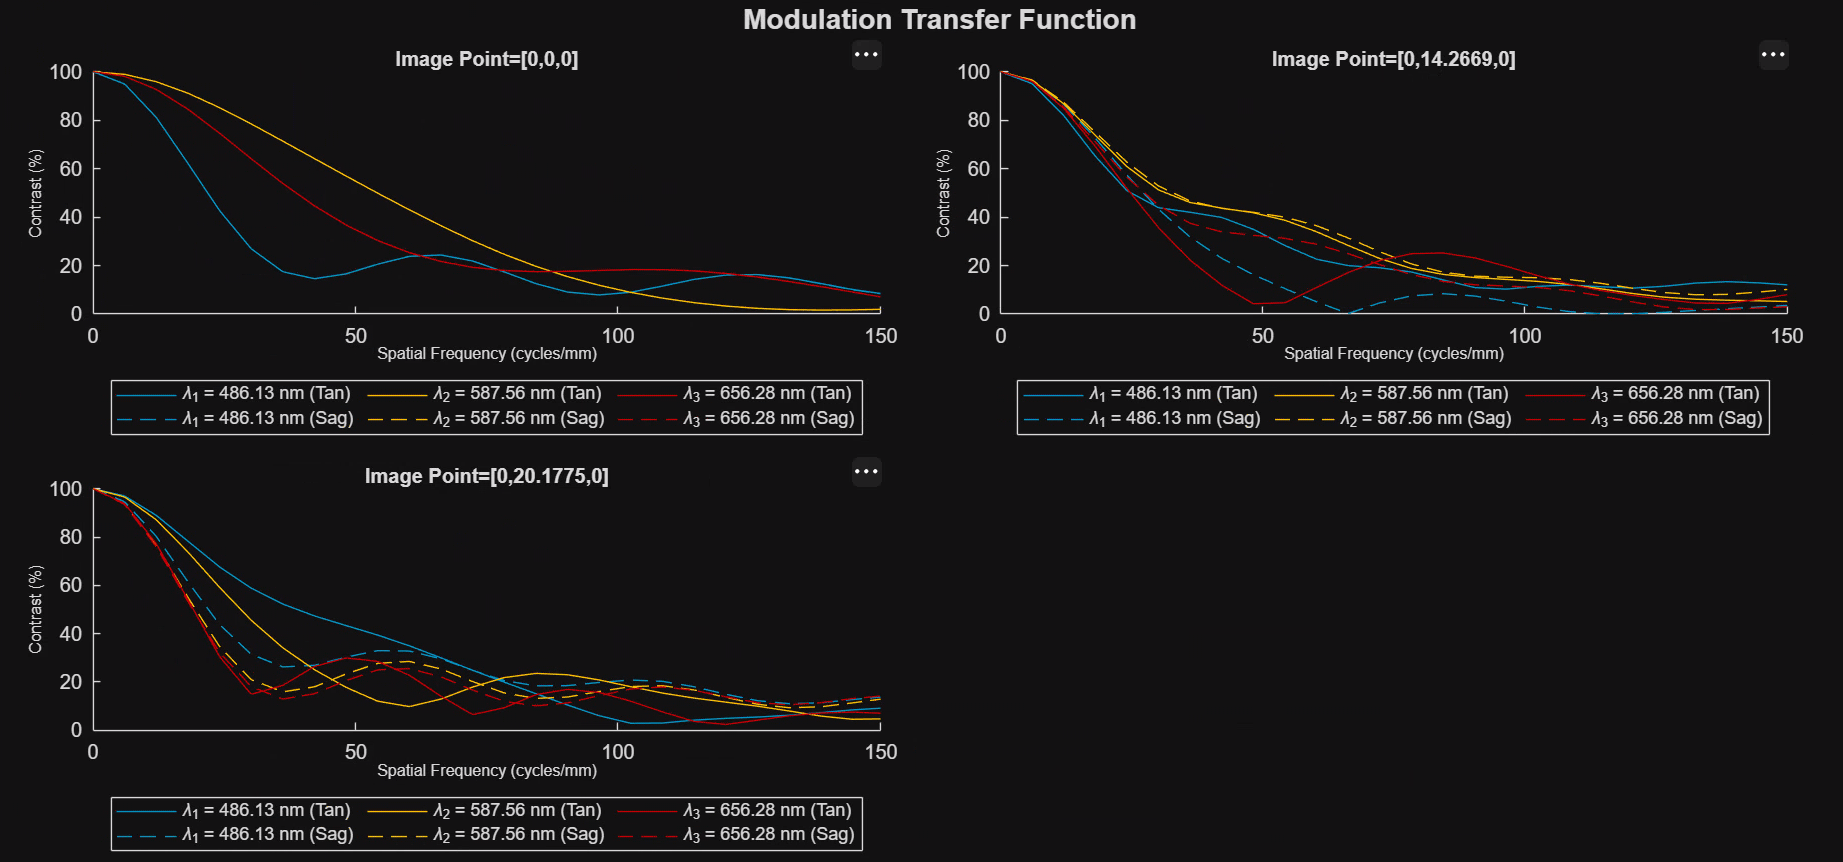
Load the sample Double Gauss lens system using zmximport. Compute the Huygens MTF by setting the Method name-value argument to "Huygens". Limit the output curves to a spatial frequency of 150 cycles per millimeter using the MaximumFrequency argument, and specify an FFTLength of 512 to achieve higher frequency resolution.
opsys = zmximport("DoubleGaussLens.zmx");
mtfr = mtf(opsys, Method="Huygens", MaximumFrequency=150, FFTLength=512);
Visualize the tangential and sagittal contrast curves as a function of spatial frequency by passing the result object to the show function.
hmtf = show(mtfr)
hmtf =
  MTFChart with properties:

               Legend: on
                 Grid: "off"
                Title: "Modulation Transfer Function"
                  MTF: [1×3 optics.result.HuygensMTF]
    WavelengthIndices: [1 2 3]
                Color: [3×3 double]
             Position: [0.0737 0.2521 0.8713 0.5977]
                Units: 'normalized'

  Show all properties
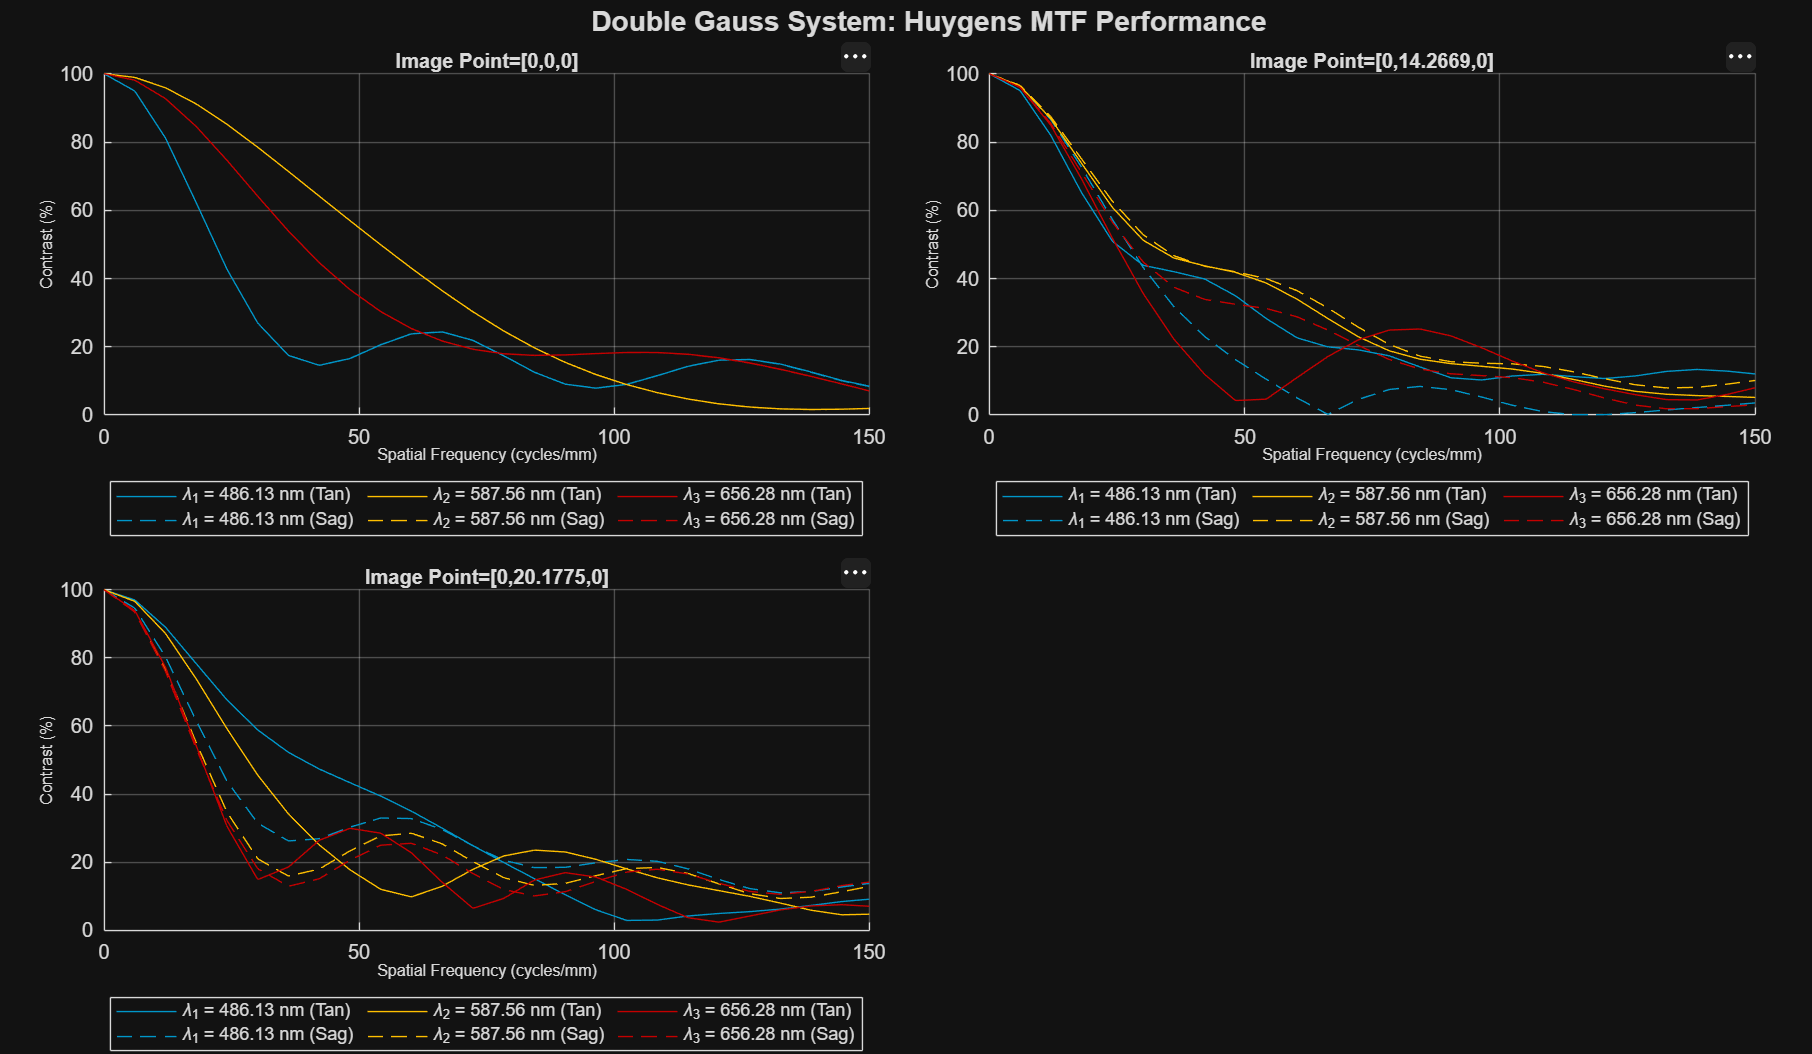
Load the sample Double Gauss lens system using zmximport. Compute the Huygens MTF across all preconfigured field points in the system. Set MaximumFrequency to 150 cycles/mm to restrict the evaluation domain, and specify an FFTLength of 512 to achieve denser, high-resolution frequency sampling for smoother curve rendering.
opsys = zmximport("DoubleGaussLens.zmx");
mtfr = mtf(opsys, Method="Huygens", MaximumFrequency=150, FFTLength=512);
Visualize the complete spatial frequency performance using the show method. Because mtfr contains data for multiple field points, the function automatically generates a tiled layout with linked axes, displaying one subplot per field point.
hMTF = show(mtfr);
hMTF.Title = "Double Gauss System: Huygens MTF Performance";
hMTF.Grid = "major";
More About
Version History
Introduced in R2026b
See Also
mtf | GeometricMTF | HuygensMTF | contrastAtFrequency | frequencyAtContrast | opticalSystem

