Geographic Statistics for Point Locations on a Sphere
Certain Mapping Toolbox™ functions compute basic geographical measures for spatial analysis and for filtering and conditioning data. Since MATLAB® functions can compute statistics such as means, medians, and variances, why not use those functions in the toolbox? First of all, classical statistical formulas typically assume that data is one-dimensional (and, often, normally distributed). Because this is not true for geospatial data, spatial analysts have developed statistical measures that extend conventional statistics to higher dimensions.
Second, such formulas generally assume that data occupies a two-dimensional Cartesian coordinate system. Computing statistics for geospatial data with geographic coordinates as if it were in a Cartesian framework can give statistically inappropriate results. While this assumption can sometimes yield reasonable numerical approximations within small geographic regions, for larger areas it can lead to incorrect conclusions because of distance measures and area assumptions that are inappropriate for spheres and spheroids. Mapping Toolbox functions appropriately compute statistics for geospatial data, avoiding these potential pitfalls.
Geographic Means
Consider the problem of calculating the mean position of a collection of
geographic points. Taking the arithmetical mean of the latitudes and longitudes
using the standard MATLAB
mean function may seem reasonable, but doing this could yield
misleading results.
Take two points at the same latitude, 180° apart in longitude, for example (30°N,90°W) and (30°N,90°E). The mean latitude is (30+30)/2=30, which seems right. Similarly, the mean longitude must be (90+(-90))/2=0. However, as one can also express 90°W as 270°E, (90+270)/2=180 is also a valid mean longitude. Thus there are two correct answers, the prime meridian and the dateline. This demonstrates how the sphericity of the Earth introduces subtleties into spatial statistics.
This problem is further complicated when some points are at different latitudes. Because a degree of longitude at the Arctic Circle covers a much smaller distance than a degree at the equator, distance between points having a given difference in longitude varies by latitude.
Is in fact 30°N the right mean latitude in the first example? The mean position of two points should be equidistant from those two points, and should also minimize the total distance. Does (30°N,0°) satisfy these criteria?
dist1 = distance(30,90,30,0)
dist1 =
	75.5225
dist2 = distance(30,-90,30,0)
dist2 =
	75.5225
Consider a third point, (lat,lon), that is
also equidistant from the above two points, but at a lesser distance:
dist1 = distance(30,90,lat,lon)
dist1 =
	60.0000
dist2 = distance(30,-90,lat,lon)
dist2 =
	60.0000
What is this mystery point? The lat is 90°N, and any
lon will do. The North Pole is the true geographic mean of
these two points. Note that the great circle containing both points runs through the
North Pole (a great circle represents the shortest path between two points on a
sphere).
The Mapping Toolbox function meanm determines the geographic mean of
any number of points. It does this using three-dimensional vector addition of all
the points. For example, try the following:
lats = [30 30];
longs = [-90 90];
[latbar,longbar] = meanm(lats,longs)
latbar =
	90
longbar =
	0
This is the answer you now expect. This geographic mean can result in one oddity;
if the vectors all cancel each other, the mean is the center of the planet. In this
case, the returned mean point is (NaN,NaN) and a warning is
displayed. This phenomenon is highly improbable in real data,
but can be easily constructed. For example, it occurs when all the points are
equally spaced along a great circle. Try taking the geographic mean of (0°,0°),
(0°,120°), and (0°,240°), which trisect the equator.
elats = [0 0 0];
elons = [0 120 240];
meanm(elats,elons)
MATLAB issues a warning and returns a vector of NaN
values.
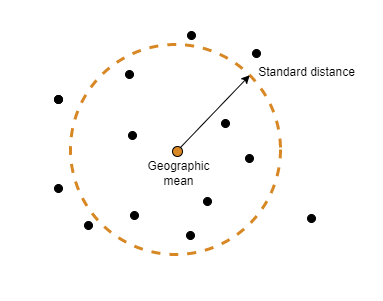
Geographic Standard Deviation
As you might now expect, the Cartesian definition of standard deviation provided
in the standard MATLAB function std is also inappropriate for geographic
data that is unprojected or covers a significant portion of a planet. Depending upon
your purpose, you might want to use the separate geographic deviations for latitude
and longitude provided by the function stdm, or the single
standard distance provided in stdist. Both methods measure the
deviation of points from the mean position calculated by
meanm.
The Meaning of stdm
The stdm function handles the latitude and longitude
deviations separately.
[latstd,lonstd] = stdm(lat,lon)
The function returns two deviations, one for latitudes and one for longitudes.
Latitude deviation is a straightforward standard deviation calculation from
the mean latitude (mean parallel) returned by meanm. This is
a reasonable measure for most cases, since on a sphere at least, a degree of
latitude always has the same arc length.
Longitude deviation is another matter. Simple calculations based on sum-of-squares angular deviation from the mean longitude (mean meridian) are misleading. The arc length represented by a degree of longitude at extreme latitudes is significantly smaller than that at low latitudes.
The term departure is used to represent the arc length
distance along a parallel of a point from a given meridian. For example,
assuming a spherical planet, the departure of a degree of longitude at the
Equator is a degree of arc length, but the departure of a degree of longitude at
a latitude of 60° is one-half a degree of arc length. The
stdm function calculates a sum-of-squares departure
deviation from the mean meridian.
If you want to plot the one-sigma lines for stdm, the
latitude sigma lines are parallels. However, the longitude sigma lines are not
meridians; they are lines of constant departure from the mean parallel.
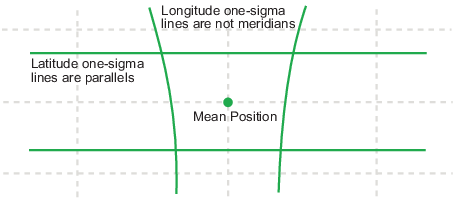
This handling of deviation has its problems. For example, its dependence upon
the logic of the coordinate system can cause it to break down near the poles.
For this reason, the standard distance provided by stdist is
often a better measure of deviation. The stdm handling is
useful for many applications, especially when the data is not global. For
instance, these potential difficulties would not be a danger for data points
confined to the country of Mexico.
The Meaning of stdist
The standard distance of geographic data is a measure of the dispersion of the data in terms of its distance from the geographic mean. Among its advantages are its applicability anywhere on the globe and its single value:
dist = stdist(lat,lon)
In short, the standard distance is the average, norm, or cubic
norm of the distances of the data points in a great circle sense
from the mean position. It is probably a superior measure to the two deviations
returned by stdm except when a particularly latitude- or
longitude-dependent feature is under examination.