pdemesh
Plot PDE mesh
Syntax
Description
pdemesh( plots the mesh
represented by the fegeometry)Mesh property of an
fegeometry object.
pdemesh(___,
plots the mesh or solution data using any of the arguments in the previous
syntaxes and one or more Name,Value)Name,Value pair arguments.
h = pdemesh(___)
Examples
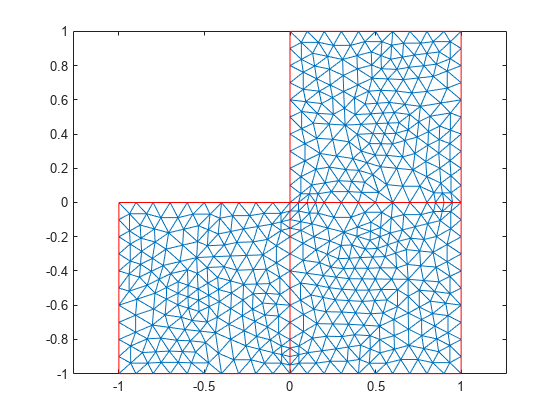
Mesh Plot for L-Shaped Membrane
Create a mesh plot and display the node and element labels of the mesh.
Create a PDE model. Include the geometry of the built-in function lshapeg. Mesh the geometry.
model = createpde;
geometryFromEdges(model,@lshapeg);
mesh = generateMesh(model);
Plot the mesh.
pdemesh(model)

Alternatively, you can plot a mesh by using mesh as an input argument.
pdemesh(mesh)

Another approach is to use the nodes and elements of the mesh as input arguments for pdemesh.
pdemesh(mesh.Nodes,mesh.Elements)

Display node labels.
pdemesh(model,NodeLabels="on")
Use xlim and ylim to zoom in on particular nodes.
xlim([-0.4,0.4])
ylim([-0.4,0.4])

Display element labels.
pdemesh(model,ElementLabels="on")
xlim([-0.4,0.4])
ylim([-0.4,0.4])
Apply boundary conditions, specify coefficients, and solve the PDE.
applyBoundaryCondition(model,"dirichlet", ...
                             Edge=1:model.Geometry.NumEdges, ...
                             u=0);
specifyCoefficients(model,m=0,...
                          d=0,...
                          c=1,...
                          a=0,...
                          f=1);
generateMesh(model);
results = solvepde(model)
results =
  StationaryResults with properties:

    NodalSolution: [1141x1 double]
       XGradients: [1141x1 double]
       YGradients: [1141x1 double]
       ZGradients: []
             Mesh: [1x1 FEMesh]
u = results.NodalSolution;
Plot the solution at nodal locations by using pdemesh.
pdemesh(model,u)

The pdemesh function ignores NodeLabels and ElementLabels when you plot solution data as a 3-D plot.
Transparency for 3-D Mesh
Create a PDE model, include the geometry and mesh it.
model = createpde;
importGeometry(model,"Plate10x10x1.stl");
generateMesh(model,Hmax=5);
Plot the mesh setting the transparency to 0.5.
pdemesh(model,FaceAlpha=0.5)
![]()
Elements Associated with Particular Face
Find the elements associated with a geometric region.
Create a PDE model.
model = createpde;
Include the geometry of the built-in function lshapeg. Plot the geometry.
geometryFromEdges(model,@lshapeg);
pdegplot(model,FaceLabels="on",EdgeLabels="on")

Generate a mesh.
mesh = generateMesh(model,Hmax=0.5);
Find the elements associated with face 2.
Ef2 = findElements(mesh,"region",Face=2);Highlight these elements in green on the mesh plot.
figure
pdemesh(mesh,ElementLabels="on")
hold on
pdemesh(mesh.Nodes,mesh.Elements(:,Ef2),EdgeColor="green")

[p,e,t] Mesh Plot
Plot the mesh for the geometry of the L-shaped membrane.
[p,e,t] = initmesh("lshapeg");
[p,e,t] = refinemesh("lshapeg",p,e,t);
pdemesh(p,e,t)
Now solve Poisson's equation over the geometry defined by the L-shaped membrane. Use Dirichlet boundary conditions on , and plot the result.
u = assempde("lshapeb",p,e,t,1,0,1);
pdemesh(p,e,t,u)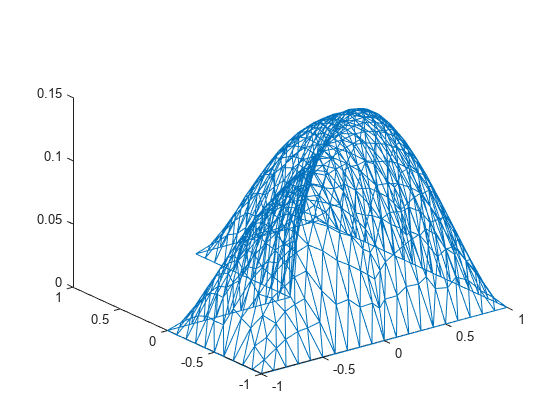
Input Arguments
model — Model container
femodel object | PDEModel object | ThermalModel object | StructuralModel object | ElectromagneticModel object
Model container, specified as an femodel object,
PDEModel object, ThermalModel
object, StructuralModel object, or
ElectromagneticModel object.
u — PDE solution
vector | matrix
PDE solution, specified as a vector or matrix.
Example: results = solvepde(model); u =
results.NodalSolution; or u =
assempde(model,c,a,f);
fegeometry — Geometry object for finite element analysis
fegeometry object
Geometry object for finite element analysis, specified as an fegeometry object. The pdemesh function
plots the mesh from the Mesh property of the fegeometry object.
mesh — Mesh description
FEMesh object
Mesh description, specified as an FEMesh
object. See FEMesh Properties.
nodes — Nodal coordinates
2-by-NumNodes matrix | 3-by-NumNodes matrix
Nodal coordinates, specified as a 2-by-NumNodes matrix for a 2-D mesh and 3-by-NumNodes matrix for a 3-D mesh. NumNodes is the number of nodes.
elements — Element connectivity matrix in terms of node IDs
NodesPerElem-by-NumElements
matrix
Element connectivity matrix in terms of node IDs, specified as an NodesPerElem-by-NumElements matrix. NodesPerElem is the number of nodes per element. Linear meshes contain only corner nodes, so there are three nodes per a 2-D element and four nodes per a 3-D element. Quadratic meshes contain corner nodes and nodes in the middle of each edge of an element. For quadratic meshes, there are six nodes per a 2-D element and 10 nodes per a 3-D element.


Name-Value Arguments
Specify optional pairs of arguments as
Name1=Value1,...,NameN=ValueN, where Name is
the argument name and Value is the corresponding value.
Name-value arguments must appear after other arguments, but the order of the
pairs does not matter.
Before R2021a, use commas to separate each name and value, and enclose
Name in quotes.
Example: pdemesh(model,NodeLabels="on")
Output Arguments
Version History
Introduced before R2006aYou can also select a web site from the following list:
Americas
- América Latina (Español)
- Canada (English)
- United States (English)
Europe
- Belgium (English)
- Denmark (English)
- Deutschland (Deutsch)
- España (Español)
- Finland (English)
- France (Français)
- Ireland (English)
- Italia (Italiano)
- Luxembourg (English)
- Netherlands (English)
- Norway (English)
- Österreich (Deutsch)
- Portugal (English)
- Sweden (English)
- Switzerland
- United Kingdom (English)