Contenido principal

Generate Derived Data Sheets

R2026b

You can use built-in MATLAB® scripts to generate derived data sheets for specific blocks. Derived data sheets contain summary tables and characteristic plots based on the block parameter values in your model. These tables and plots are similar to those that device manufacturers provide in their data sheets. Use derived data sheets to:

  • Explore the effect of your parameter choices on device characteristics.

  • Confirm that the block behaves as you expect, if you parameterized the block to match the manufacturer specifications of a specific part.

  • Help you choose a part from a manufacturer, if you tuned the block parameter values so that your Simscape™ model satisfies your system-level design requirements.

  • Communicate your design to others.

To generate a derived data sheet:

  1. Open the MATLAB script by clicking the Open live script button next to the Derived data sheet parameter in the Utilities section of the block dialog box.

  2. In the script that opens, provide values for any additional variables that the data sheet requires.

    For example, the derived data sheet for the PMSM block contains this code block under the Enter Parameter Values heading. You can specify a new value for the peak line current in amps by replacing the numerical value, 30, in the Peak of line current (A) text box.

    Code block from the PMSM block derived data sheet with text boxes for you to specify additional variables. These variables are the peak line current in amps, the peak maximum allowable line current in amps, the maximum stator line-to-line peak voltage in volts, the rated speed in rpm, and the maximum rotor speed in rpm.

  3. Click the Generate Data Sheet button in the script.

Depending on the block, MATLAB either:

  • Calculates the characteristics by substituting your block parameter values into the defining equations.

  • Simulates a harness with a copy of your block in Simulink® over a range of conditions, then imports the results to MATLAB.

The script then generates a specification table and plots the results. For example, the derived data sheet for the PMSM block with default parameter values contains this table under the Generate Specification Tables heading.

    Parameter                  Value      Unit
    Continuous Stall Torque    2.31       Nm  
    Peak Torque                7.10       Nm  
    Rated Speed                1800.00    rpm 
    Peak of Stall Current      10.56      A   
    Peak of Maximum Current    31.68      A   
    Rated Power                0.44       kW  

The derived data sheet for the PMSM block also contains:

  • A plot that shows torque and current versus rotor speed at both peak torque and maximum AC voltage
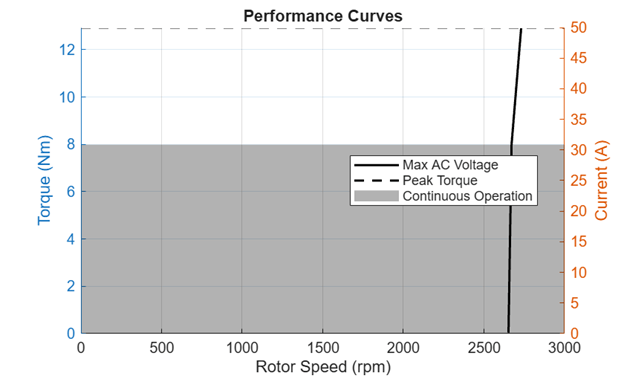
    Plot showing torque and current versus rotor speed at peak torque and the maximum AC voltage.

  • Subplots of torque, efficiency, shaft power, and stator current versus rotor speed at 50% and 100% of the rated stator current
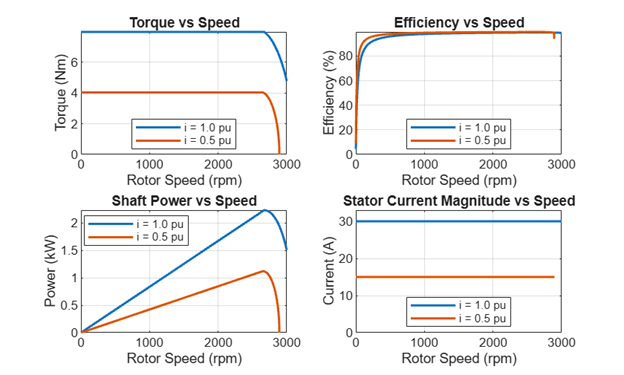
    Subplots of torque, efficiency, shaft power, and stator current versus rotor speed at 50% and 100% of the rated stator current.

You can compare these plots and summary tables to manufacturer data sheets, either to check that you have parameterized the block correctly or to help you select a manufactured part.

MATLAB stores the data displayed in the summary table and plots, as a structure in the workspace. The structure for the PMSM block is named pmsmDataSheet. You can use this structure to postprocess the data.

To compare plots and summary tables for devices with different characteristics:

  1. Save the results by renaming the structure so that MATLAB does not replace it with new results when you regenerate the data sheet.

  2. Change the input variables in the top section of the MATLAB script or the parameter values in the block mask.

  3. Click the Generate Data Sheet button or run the MATLAB script again.

The block you generate the data sheet for must be the currently selected block in your Simulink model. If you make changes to your model, click the block before regenerating the data sheet.

Blocks That Support Derived Data Sheets

This table shows the blocks that support derived data sheets in the Simscape Electrical™ sublibraries.

If you want to generate summary tables and characteristics plots of block-level characteristics, but your block does not support derived data sheets, you can use Display or Plot buttons, respectively, in the Utilities section of the block parameters. For more information, see Visualize Block Parameterization by Plotting Characteristic Curves.

If your block does not support Utilities, or if the buttons do not generate the plots and summary information you need, you can build your own harness. To learn how to build harnesses and plot block-level characteristics, see the featured examples in the Visualize, Validate, and Tune Parameter Values category.

BlockAdditional Input VariablesDerivationSpecification TablePlotsAdditional Information
BLDC
  • Rated voltage

  • Rated speed

Harness
  • Rated voltage

  • Rated speed

  • Rated torque

  • Rated current

  • Maximum power

  • Stall torque

  • Stall current

  • Back-EMF constant

  • Number of pole pairs

  • Speed, current, mechanical power, and efficiency versus torque

 
DC Motor
  • Rated voltage

  • Rated torque

Harness
  • Rated torque

  • Rated voltage

  • Rated speed

  • Rated current

  • Maximum power

  • Stall torque

  • Stall current

  • Back EMF-constant

  • Torque constant

  • Speed, current, mechanical power, and efficiency versus torque

 
Diode

To plot forward current versus forward voltage:

  • Supply voltage

  • Maximum forward current

  • Temperature vector

To plot reverse current versus reverse voltage:

  • Breakdown voltage

  • Maximum forward current

  • Temperature vector

To plot reverse switching characteristics and generate the summary table:

  • Reverse voltage

  • Initial forward current

Harness

Reverse switching characteristics:

  • Peak reverse current

  • Reverse recovery time

  • Reverse recovery charge

  • Reverse recovery energy

  • Softness factor

  • Forward current versus forward voltage at different temperatures

  • Reverse current versus reverse voltage at different temperatures

  • Reverse switching characteristics — Current versus time

  • Reverse recovery loss characteristics — Current versus reverse recovery loss

  • To generate I-V curves at multiple temperatures, set the Modeling option parameter to Detailed with charge dynamics and choose one of these options:

    • Set the Diode model parameter to Exponential and set the Parameterization parameter, in the Temperature Dependence settings, to one of these options:

      • Use an I-V data point at second measurement temperature T2

      • Specify saturation current at second measurement temperature T2

      • Specify the energy gap, EG

    • Set the Diode model parameter to Tabulated I-V curveand clear the Show thermal port parameter.

  • To plot reverse current versus reverse voltage, select the Model Zener Diode parameter.

  • To plot reverse switching characteristics, set the Modeling option parameter to Detailed with charge dynamics and set the Charge dynamics parameter to one of these options:

    • Use peak reverse current and stretch factor

    • Use peak reverse current and reverse recovery time

    • Use peak reverse current and reverse recovery charge

    • Use peak reverse current and reverse recovery energy

    • Use transit time and carrier lifetime

  • To plot reverse recovery loss characteristics, set the Modeling option parameter to Ideal with thermal losses.

IGBT (Ideal, Switching)NoneDefining equations
  • On-state resistance

  • Threshold voltage

  • Off-state conductance

To include these additional variables in the specification table, in the block dialog box, set the Modeling option parameter to Show thermal port and the On-state behavior and switching losses parameter to Tabulate:

  • Maximum on-state collector-emitter voltage

  • Maximum collector-emitter current

  • Junction temperature

  • Collector current versus collector-emitter voltage at different temperatures

  • Switch-on loss and switch-off loss versus collector current at different temperatures

  • Surface plots of switching losses, with respect to the on-state current and off-state voltage, at different temperatures

  • Surface plot of switching losses, with respect to on-state current and junction temperature, at the maximum off-state voltage

  • Forward voltage versus current of the body diode at different temperatures

  • Reverse recovery loss versus diode current

  • Surface plots of the reverse recovery loss, as a function of the on-state current and off-state voltage, at different temperatures

  • Surface plot of the reverse recovery loss, as a function of the on-state current and junction temperature, at the maximum off-state voltage

  • Off-state collector current voltage versus off-state collector-emitter voltage

  • Off-state forward voltage versus current of the body diode

  • You can choose whether to run parameter value validation checks by using the ignoreInvalidBlockData argument. If you set this argument to false, the block throws an error if the block parameter values are invalid for simulation. For example, some parameters only support nonnegative values. If you set this argument to true, the data sheet plots the results for the data you provide without running the checks.

  • To plot characteristics at different temperatures or to plot switching losses, set the Modeling option parameter to Show thermal port. If you set the plotAllTemperatures argument to true, MATLAB generates plots at all the temperature values that you provide in the block mask. If you set the plotAllTemperatures argument to false, MATLAB generates plots at the maximum and minimum temperatures and two equidistant points between them.

  • To plot IGBT characteristics at different temperatures, set the On-state behavior and switching losses parameter to Tabulate.

  • To plot diode characteristics, set the Integral protection diode parameter to Diode with no dynamics.

  • To plot diode characteristics at different temperatures, set the Diode model parameter to Tabulated I-V curve.

Induction Machine Squirrel CageNoneHarness
  • Rated apparent power

  • Number of poles

  • Frequency

  • Line-to-line RMS voltage

  • Rated torque

  • Line RMS current

  • Rated speed

  • Slip

  • Rated output power

  • Rated reactive power

  • Rated power factor

  • Torque and line-to-line RMS current versus normalized speed at the rated voltage and frequency

  • Torque versus speed at different stator voltages for a constant ratio of voltage to frequency

You can plot characteristics for wye, delta, or both winding configurations by selecting a value for the WindingConfiguration dropdown list in the script.
Magnetic CoreNoneHarness
  • Relative permeability

  • Remanence

  • Coercivity

  • Saturation flux density, B

  • Field intensity, H, at flux saturation

  • Hysteresis power loss

  • Eddy current power loss

  • Flux density versus magnetic field intensity (B-H curve):

    • Without eddy current effects

    • With inner loops, at a fixed frequency

    • With eddy current losses, at different frequencies

  • Hysteresis and eddy current losses:

    • Versus flux density at a fixed frequency

    • Versus frequency at a fixed flux density

  • To include eddy current power loss in the specification table or to plot eddy current losses, select Model eddy current in the block dialog box.

  • The Magnetic Core block estimates the Jiles-Atherton parameters based on the assumption that the core is saturated iron. You can obtain these estimates by generating a derived data sheet. Then, adjust the values to fit your data. For more information, see the Model Ferrite Core Using Magnetic Core Block example.

MOSFET (Ideal, Switching)NoneDefining equations
  • On-state drain-to-source resistance

  • Threshold voltage

  • Off-state conductance

To include these additional variables in the specification table, in the block dialog box, set the Modeling option parameter to Show thermal port and the On-state behavior and switching losses parameter to Tabulate:

  • Maximum on-state drain-source voltage

  • Maximum drain-source current

  • Junction temperature

  • Drain current versus drain-source voltage at different temperatures

  • Switch-on loss and switch-off loss versus drain current at different temperatures

  • Surface plots of switching losses, with respect to the on-state current and off-state voltage, at different temperatures

  • Surface plot of switching losses, with respect to on-state current and junction temperature, at the maximum off-state voltage

  • Forward voltage versus current of the body diode at different temperatures

  • Reverse recovery loss versus diode current

  • Surface plots of the reverse recovery loss, as a function of the on-state current and off-state voltage, at different temperatures

  • Surface plot of the reverse recovery loss, as a function of the on-state current and junction temperature, at the maximum off-state voltage

  • Off-state drain current voltage versus off-state drain-source voltage

  • Off-state forward voltage versus current of the body diode

  • You can choose whether to run parameter value validation checks by using theignoreInvalidBlockData argument. If you set this argument to false, the block throws an error if the block parameter values are invalid for simulation. For example, some parameters only support nonnegative values. If you set this argument to true, the data sheet plots the results for the data you provide without running the checks.

  • To plot characteristics at different temperatures or to plot switching losses, set the Modeling option parameter to Show thermal port. If you set the plotAllTemperatures argument to true, MATLAB generates plots at all the temperature values that you provide in the block mask. If you set the plotAllTemperatures argument to false, MATLAB generates plots at the maximum and minimum temperatures and two equidistant points between them.

  • To plot MOSFET characteristics at different temperatures, set the On-state behavior and switching losses parameter to Tabulate.

  • To plot diode characteristics, set the Integral protection diode parameter to Diode with no dynamics.

  • To plot diode characteristics at different temperatures, set the Diode model parameter to Tabulated I-V curve.

PMSM
  • Peak line current

  • Peak maximum line current

  • Maximum stator line-to-line peak voltage

  • Rated rotor speed

  • Maximum rotor speed

Defining equations
  • Continuous stall torque

  • Peak torque

  • Rated speed

  • Peak stall current

  • Peak maximum allowable current

  • Rated power

  • Torque and current versus rotor speed at peak torque and the maximum AC voltage

  • Torque, efficiency, shaft power, and stator current versus speed at 50% and 100% of the rated stator current

  • If you set the Winding type parameter to Open-end, the calculations assume that one end connects to the ground.

Solar CellNoneHarness
  • Open-circuit voltage

  • Short-circuit current

  • Voltage at maximum power

  • Current at maximum power

  • Maximum power

  • Output voltage versus current and power:

    • At a fixed temperature and various irradiance values

    • At a fixed irradiance value and various temperatures

  • You can use these characteristic curves to evaluate the maximum power point tracking (MPPT) output, because the curves help to identify the peak power at various irradiance levels and cell temperatures.

  • Before R2026a: To open the MATLAB script: double-click the block to open the Block Parameters window, open the Description tab, and click the Generate Datasheet hyperlink.

Two-Winding Transformer (Three-Phase)NoneHarness
  • Rated apparent power

  • Rated primary voltage

  • Rated secondary voltage

  • Rated frequency

  • Open-circuit test results — Secondary voltage versus excitation current

  • Short-circuit test results — Current versus phase voltage

  • Load test results — Voltage regulation and efficiency versus load

  • Iron loss, copper loss, and total loss versus load


See Also

Simscape Blocks

Topics