Enable Logging and Breakpoints in State Transition Tables
You can debug state transition tables by using logging and breakpoints. Use logging to store and display the values of table objects during simulation. Use breakpoints to pause simulation when table components become active or meet certain conditions.
For an example that uses logging and breakpoints to debug a model, see Log, Verify, and Debug State Transition Tables.
Enable Logging
You can log the activity of a state or the values of data. After simulating the model, you can view the logs in the Simulation Data Inspector. For information on viewing simulation logs, see View Simulation Data in Simulation Data Inspector (Simulink).
Log State Activity
To log the activity of a state or its children, click the state. Then, in the Modeling tab, toggle one of these buttons on:
Log Self Activity: Logs whether the state is active or inactive at each time step.
Log Child Activity: Logs the name of the active direct child of the state at each time step.
Log Leaf Activity: Logs the name of the most hierarchically distant active child of the state at each time step. Leaf states can be direct or indirect children. For example, in this table, the state
Parent_1has leaf statesGrandchild_1,Grandchild_2, andChild_2. The statesGrandchild_1andGrandchild_2are indirect children.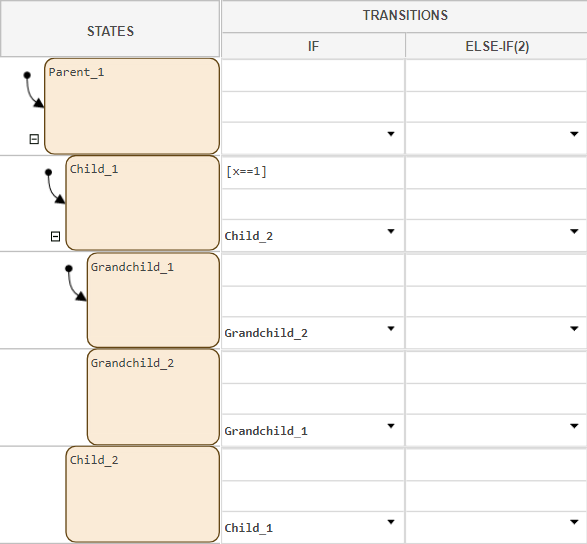
To disable logging for a state, in the Modeling tab, toggle the Log Self Activity, Log Child Activity, or Log Leaf Activity buttons off.
Log Local or Output Data
To log the values of local or output data, in the Property Inspector, in the Symbols pane, right-click the data and click Inspect. In the Logging section, select Log Signal Data.
Enable, Manage, and Save Breakpoints
You can debug table behavior during simulation by setting a breakpoint on a state or transition. Then, in the Stateflow Breakpoints and Watch window, you can manage, add conditions to, and save your breakpoints.
Enable Breakpoint on a State
To enable a breakpoint on a state, right-click the state, select Set Breakpoints, then click one of these breakpoint types:
On State Entry: Pause simulation when the state becomes active.
During State: Pause simulation on time steps when the state is active, and the table has not entered or exited the state.
On State Exit: Pause simulation when the state becomes inactive.
When you enable a breakpoint, the breakpoint badge
![]() appears in the top-right corner of the state. You can set
more than one breakpoint type on a state.
appears in the top-right corner of the state. You can set
more than one breakpoint type on a state.
To disable a breakpoint on a state, right-click the state, click Set Breakpoints, and clear all enabled breakpoint types. The breakpoint badge disappears.
Enable Breakpoint on a Transition
To enable a breakpoint on a transition, right-click the transition, click Set Breakpoints, then select one of these breakpoint types:
When Transition Is Tested: Pause simulation when the table attempts to move along the transition, even if the condition is false.
When Transition Is Valid: Pause simulation when the table successfully moves along the transition.
When you enable a breakpoint, the breakpoint badge
![]() appears on the right side of the condition row. You can
enable more than one breakpoint type on a transition. You cannot enable a
breakpoint on a transition without a destination. If you remove the destination
from a transition with a breakpoint, the breakpoint remains.
appears on the right side of the condition row. You can
enable more than one breakpoint type on a transition. You cannot enable a
breakpoint on a transition without a destination. If you remove the destination
from a transition with a breakpoint, the breakpoint remains.
To disable a breakpoint on a transition, right-click the state, click Set Breakpoints, and clear all enabled breakpoint types. The breakpoint badge disappears.
Manage, Add Conditions to, and Save Breakpoints
You can manage, add conditions to, and save breakpoints in the Stateflow
Breakpoints and Watch window. To open the window, click a breakpoint badge
![]() . Then, at the bottom of the dialog box, click
Breakpoints List.
. Then, at the bottom of the dialog box, click
Breakpoints List.
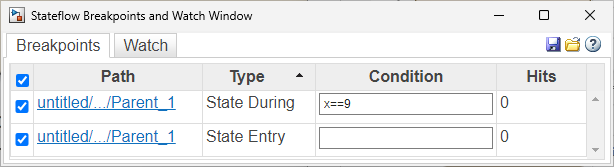
The Stateflow Breakpoints and Watch window displays all of the breakpoints in
the state transition table. When you simulate the model, the
Hits column for the breakpoint increments by
1 each time the table encounters a breakpoint.
To disable a breakpoint without deleting it, in the leftmost column, clear the
associated checkbox. To delete a breakpoint, point to the associated row in the
Path column and click the delete icon
![]() .
.
To add a condition to a breakpoint, in the Condition column, click the text field and enter a condition. The breakpoint only pauses simulation when the condition is true.
Note
Breakpoint conditions do not support temporal operators.
To save your breakpoints, in the top-right corner of the window, click the
Save icon ![]() . To load saved breakpoints, click the Load icon
. To load saved breakpoints, click the Load icon
![]() .
.