Log Data in Library Charts
You can define logging settings that apply to the linked instances of library charts. After you configure logging once in the library chart and those settings persist across multiple models. Use library charts for data collection, performance tracking, and consistent analysis across your Stateflow® models.
For more information about Stateflow chart libraries, see Reuse Charts in Models by Using Chart Libraries.
Logging Property Inheritance for Library Charts
Chart instances inherit logging properties from their parent library chart.
Chart instances maintain their own logging data during simulation.
You can override logging properties for individual signals in a given instance.
Override Logging Properties in a Linked Chart
In this example, you override the logging properties of a Chart block linked
to a library chart. The model sf_atomic_sensor_pair contains two
instances of the library chart SingleSensor from the library
sf_atomic_sensor_lib. You use the Stateflow Editor and the
Stateflow API to override the logging settings of the charts so that one of the
linked charts has different settings than the library chart.
Open the model sf_atomic_sensor_pair. This model contains two
instances of the library chart SingleSensor from the library
sf_atomic_sensor_lib.
openExample("sf_atomic_sensor_pair")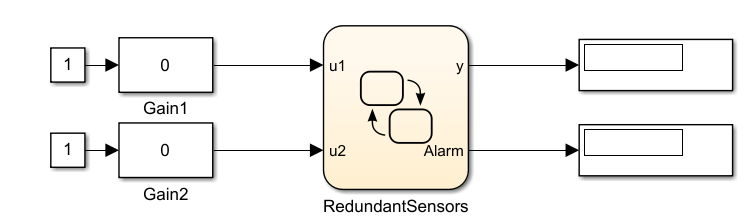
The model sf_atomic_sensor_pair simulates a redundant sensor pair by
using the linked atomic subcharts Sensor1 and
Sensor2 in the chart RedundantSensors.
Sensor1 and Sensor2 are copies of the
library chart SingleSensor from the library
sf_atomic_sensor_lib.
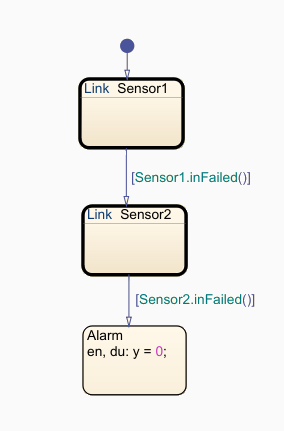
Each atomic subchart contains instances of the states Fail,
FailOnce, and OK.
Override Logging Properties by Using the Stateflow User Interface
Open the example library
sf_atomic_sensor_lib.openExample("sf_atomic_sensor_lib")In the Library tab, click Locked Library to unlock the library.
Open the
SingleSensorchart.In the Library tab, under Prepare, click Property Inspector.
Enable and customize logging for every state in the chart:
Select the state.
In the Property Inspector, select Log self activity.
In the Property Inspector, in the Logging Name drop-down list, select
Custom.In the text field, enter
Logfollowed by the state name. For example,LogOK,LogFail, andLogFailOnce.
In the
sf_atomic_sensor_pairmodel, open the Configuration Parameters dialog box.In the Data Import/Export pane, click Configure Signals to Log.
In the Simulink Signal Logging Selector window, in the Model Hierarchy pane, expand RedundantSensors > Sensor1.
The library instance inherits the logging properties from the library chart.

Override the logging properties for
Sensor1:At the top of the window, change Logging Mode to
Override
										signals
. In the Contents of pane, the selector clears the values of the DataLogging check boxes for both library charts.Enable logging for the
FailandFailOncestates by selecting the check box in the DataLogging column.Double-click the values in the LoggingName column for the signals
FailandFailOnce, and rename themLogFailSensor1andLogFailOnceSensor1, respectively.

Override Logging Properties by Using the Command-Line API
Open the example library
sf_atomic_sensor_lib.openExample("sf_atomic_sensor_lib")Unlock the library.
library = find(sfroot,"-isa","Stateflow.Machine", ...
    Name="sf_atomic_sensor_lib");
library.Locked = false;
Create an array that contains every state in the library chart. Log the signals for each state.
states = find(library,"-isa","Stateflow.State");

for i = 1: length(states)
   states(i).LoggingInfo.DataLogging = true;
end
Open the model
sf_atomic_sensor_pair. This model contains two instances of the library chart.open_system("sf_atomic_sensor_pair")Create a
ModelLoggingInfoobject for the model. This object contains an array namedSignalsthat stores all logged signals.logInfo = Simulink.SimulationData.ModelLoggingInfo.createFromModel("sf_atomic_sensor_pair")logInfo = ModelLoggingInfo with properties: Model: 'sf_atomic_sensor_pair' LoggingMode: 'OverrideSignals' LogAsSpecifiedByModels: {} Signals: [1×6 Simulink.SimulationData.SignalLoggingInfo]The
Signalsarray contains the signals marked for logging in the library chart, including:The library instances of
Fail,FailOnce, andOKstates in atomic subchartSensor1The library instances of
Fail,FailOnce, andOKstates in atomic subchartSensor2
Create a block path to the logged signals whose properties you want to override.
To access signals inside Stateflow charts, use the
Simulink.SimulationData.BlockPathobject. For more information, seeSimulink.SimulationData.BlockPath(Simulink).For example, to create block paths for the signals
Fail,FailOnce, andOKin the atomic subchartSensor1in theRedundantSensorschart, enter:failPath = Simulink.SimulationData.BlockPath( ... "sf_atomic_sensor_pair/RedundantSensors/Sensor1","Fail"); failOncePath = Simulink.SimulationData.BlockPath( ... "sf_atomic_sensor_pair/RedundantSensors/Sensor1","FailOnce"); OKPath = Simulink.SimulationData.BlockPath( ... "sf_atomic_sensor_pair/RedundantSensors/Sensor1","OK");
Get the index of each logged signal in the
Simulink.SimulationData.BlockPathobject.failidx = logInfo.findSignal(failPath); failOnceidx = logInfo.findSignal(failOncePath); OKidx = logInfo.findSignal(OKPath);
Override the logging properties for the signals in
Sensor1:Disable logging for signal
OK.logInfo.Signals(OKidx).LoggingInfo.DataLogging = false;
Enable and set custom names.
logInfo.Signals(failidx).LoggingInfo.NameMode = true;
logInfo.Signals(failOnceidx).LoggingInfo.NameMode = true;

logInfo.Signals(failidx).LoggingInfo.LoggingName = "LogFailSensor1";
logInfo.Signals(failOnceidx).LoggingInfo.LoggingName = "LogFailOnceSensor1";
Apply the changes.
set_param(bdroot,DataLoggingOverride=logInfo);
See Also
Simulink.SimulationData.ModelLoggingInfo (Simulink) | Simulink.SimulationData.BlockPath (Simulink)