Resultados de
Hello everyone,
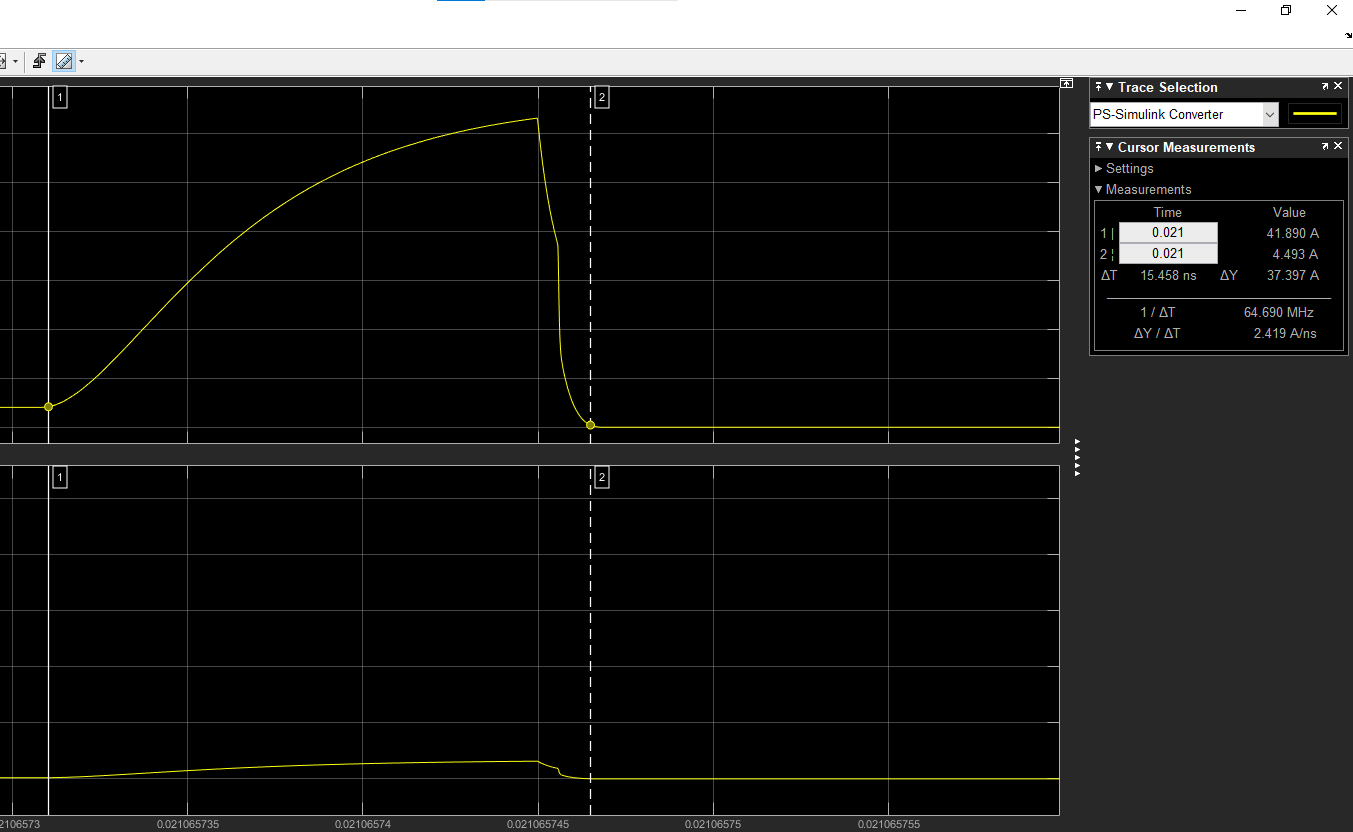
Im trying to simulate an 3-phase inverter, and for analysis of semicondcutor switches cuurent and voltage, I witness some unusal behaviour. I have connected a current sensor to the drain to calculate and visialize drain current, but the waveform is lookibg something like in picture if instaneous overshooting when going form high to low or vice versa, and the magnitude of the overshooting pulse can reach upto 500 Amps.
Kindly, guide me what am i doing here wrong? and one more thing is that I have set the Ids current to be 63Amps for N-channel Mosfet, but the output is 42-44 Amp max, what could be the reason behind it?
Thank you in advance!!
I would tell myself to understand vectorization. MATLAB is designed for operating on whole arrays and matrices at once. This is often more efficient than using loops.
Is there a reason for TMW not to invest in 3D polyshapes? Is the mathematical complexity of having all the same operations in 3D (union, intersection, subtract,...) prohibitive?
I have been developing a neural net to extract a set of generative parameters from an image of a 2-D NMR spectrum. I use a pair of convolution layers each followed by a fullyconnected layer; the pair are joined by an addtion layer and that fed to a regression layer. This trains fine, but answers are sub-optimal. I woudl like to add a fully connected layer between the addtion layer and regression, but training using default training scripts simply won't converge. Any suggestions? Maybe I can start with the pre-trained weights for the convolution layers, but I don't know how to do this.
JHP
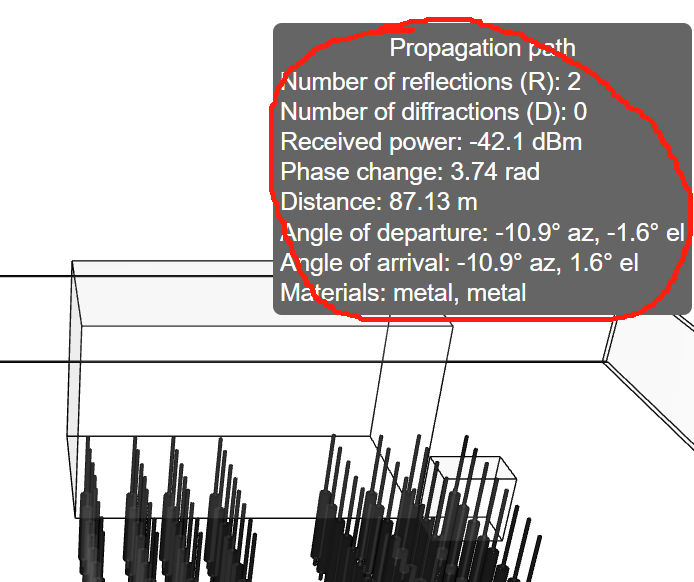
how can I do to get those informations?
I noticed a couple new replies show up on the recent poll a day or so ago, but since then, the page can't be loaded anymore in any browser I've tried.

Is MathWorks going to spend 5 years starting in 2024 making Python the #1 supported language?
I'm not sure it's authentic information, and am looking forward to a high level of integration with python.
Reference:
This is not a question, it is my attempt at complying with the request for thumbs up/down voting. I vote thumbs up, for having AI.....
I am not sure if specific AI errors are to be reported. Other messages I just read from others here and the AI Chat itself clearly state that errors abound.
My AI request was: "Plot 300 points of field 2"
AI Chat gave me, in part:
data = thingSpeakRead(channelID, 'Fields', 2, 'NumPoints', 300, 'ReadKey', readAPIKey);
% Extract the field values
field1Values = data.Field1;
% Plot the data
plot(field1Values);
The AI code failed due to "Dot indexing is not supported for variables of this type"
So, I corrected the code thus to get the correct plot:
data = thingSpeakRead(channelID, 'Fields', 2, 'NumPoints', 300, 'ReadKey', readAPIKey);
% Extract the field values
%field1Values = data.Field1;
% Plot the data
plot(data);
I see great promise in AI Chat.
Opie
Hello Everyone,
I want to model an electric vehicle in simscape electrical, I have few quiries regarding it.
- I have modelled an 3-Phase inverter, and used ee_getPowerLossSumary to get switching losses, and the results are okay as i was expecting, but now is there any other function to calculate conduction losses?
- I want to connect a BLDC motor, I have few parameters from manufacturers datasheet, but not all the parameters, so what would the best way according to your understanding, to model motor losses (Copper + Core).
I'm trying to calculate major fundamental losses of an EV. Looking for your inputs on this.
Thank you!
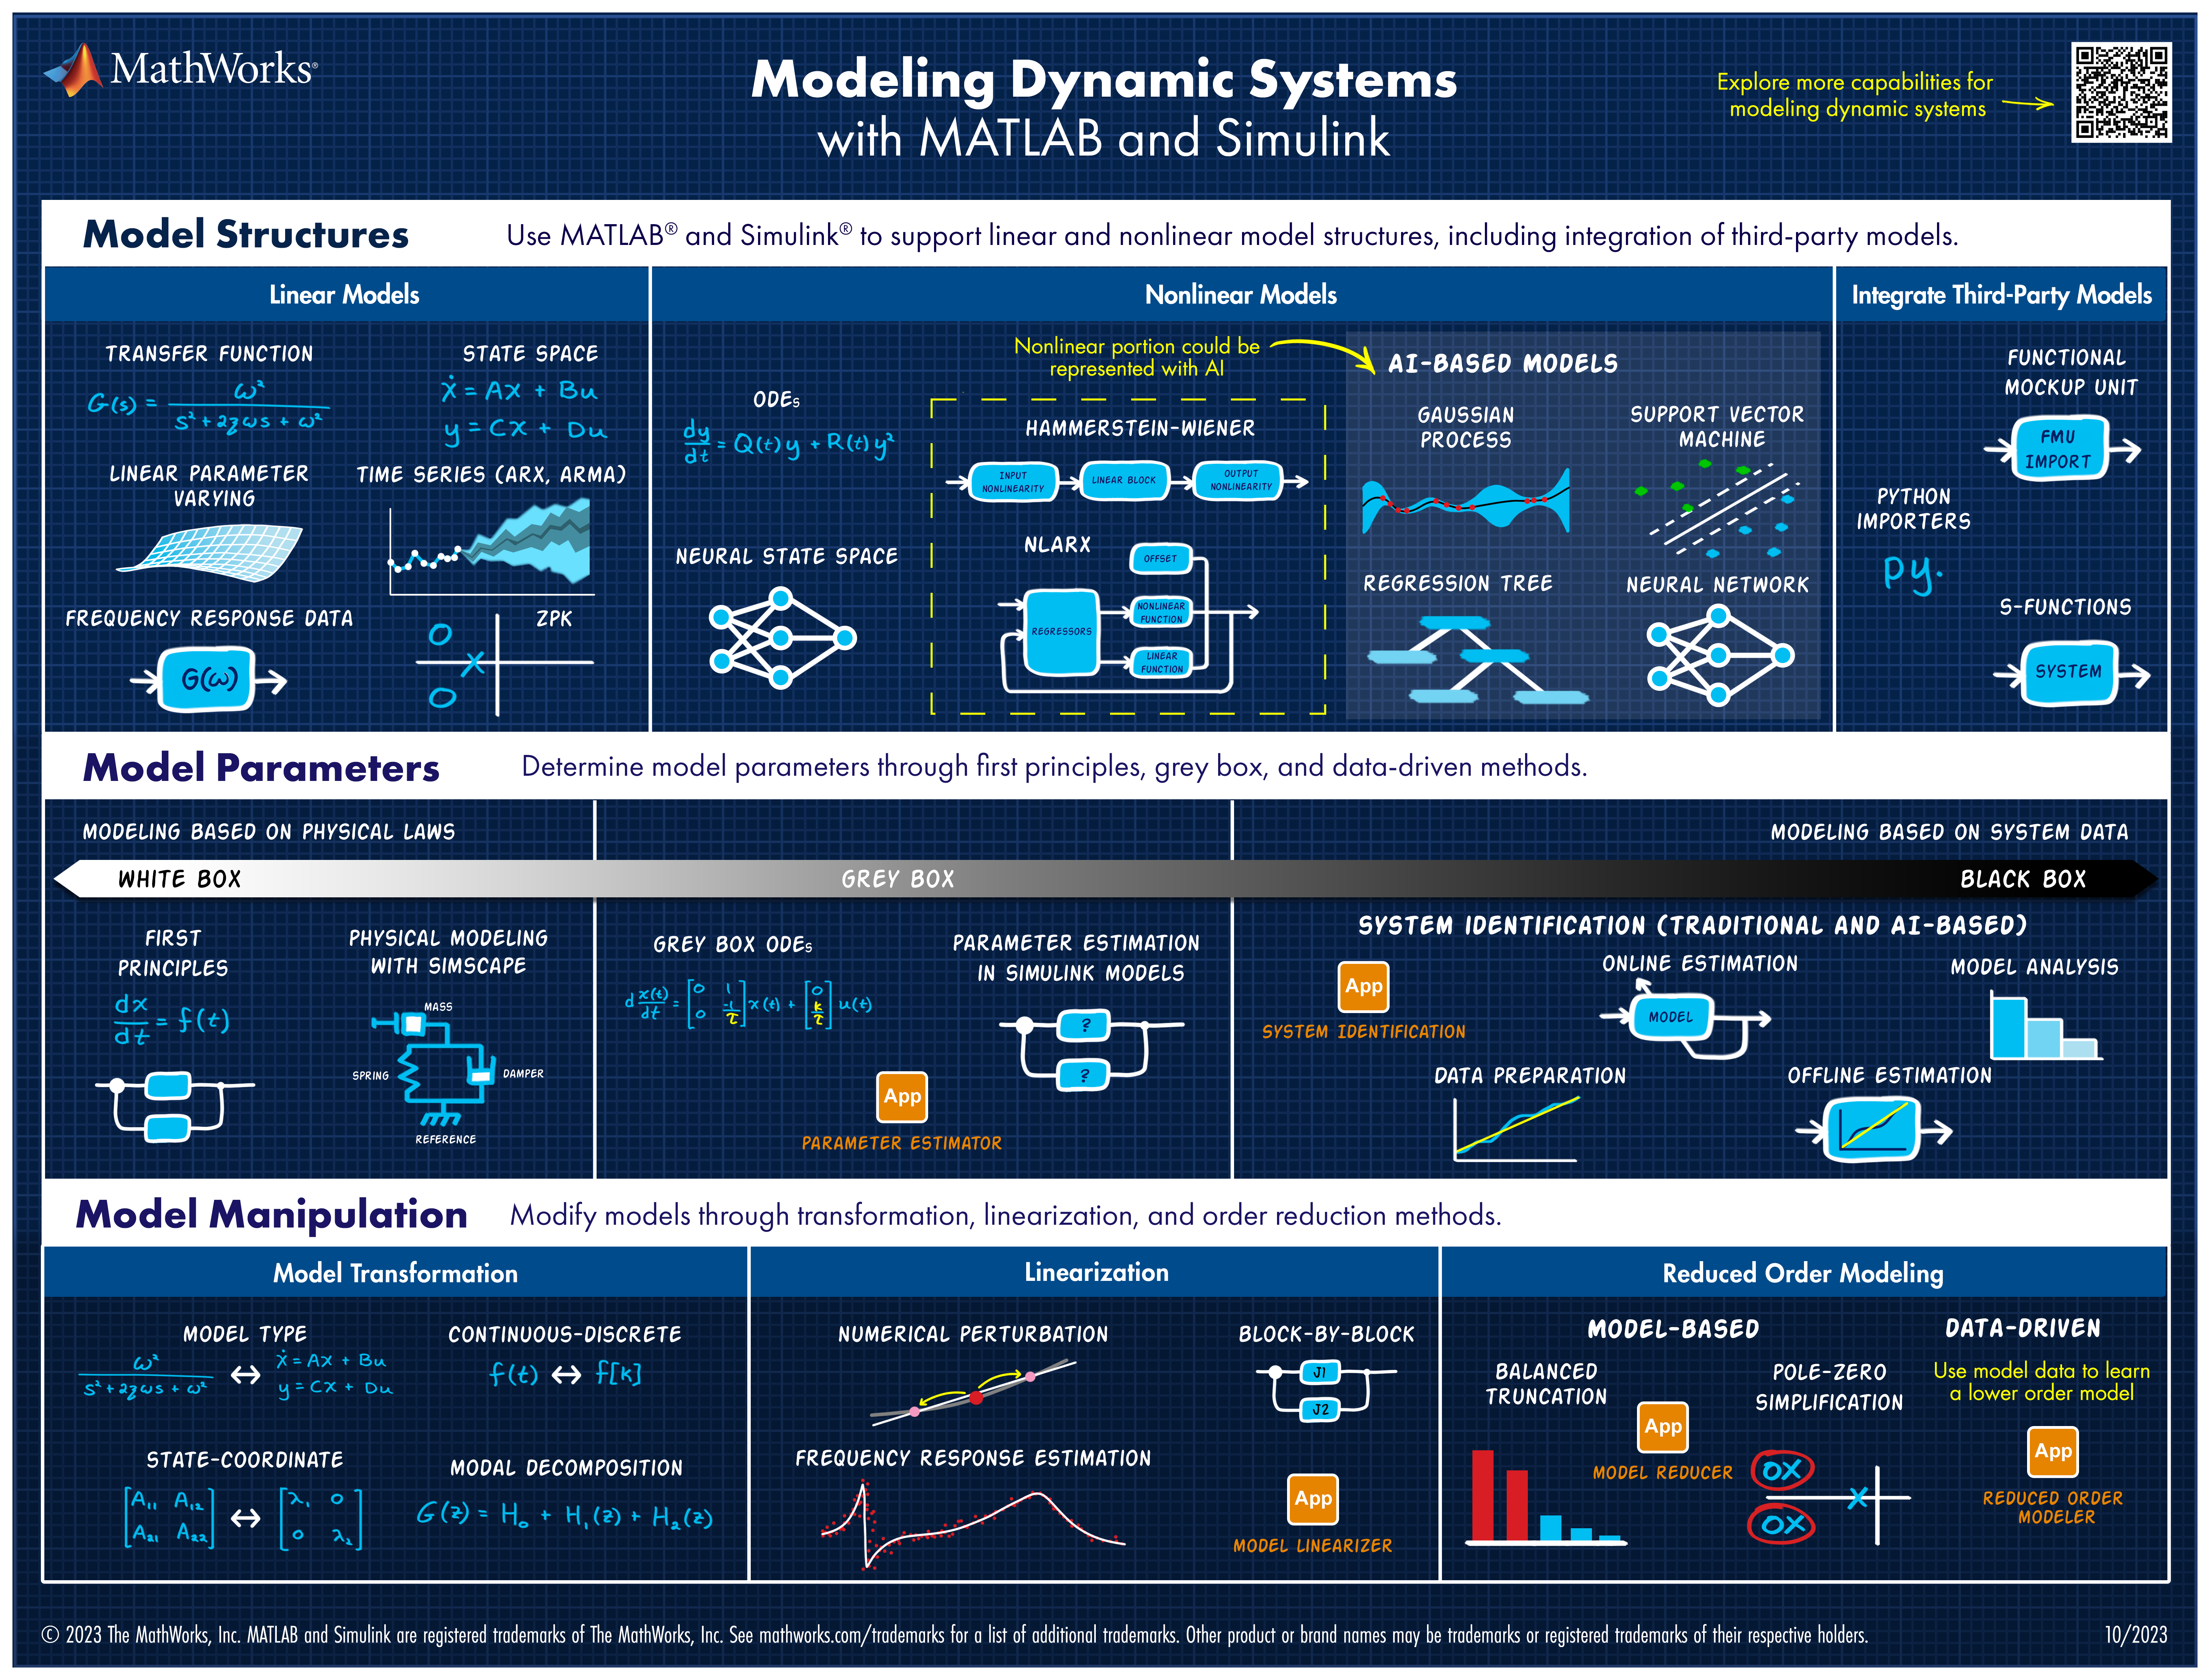
Explore all the capabilities for Modeling Dynamic Systems while keeping them handy with this Cheat Sheet - Download Now.
Hi! I'm new to pk modeling and Matlab. Can someone guide me through how to conduct population pk modeling based on pk parameters from non-human primate studies? Much thanks!!!!
I have encountered a problem. I want to study the direction of PHEVP2 configuration energy control strategy, but the whole vehicle model has stumped me. I don't know how to proceed, and every time I run, an error message will be reported. I don't understand where the problem lies?
Quick answer: Add set(hS,'Color',[0 0.4470 0.7410]) to code line 329 (R2023b).
Explanation: Function corrplot uses functions plotmatrix and lsline. In lsline get(hh(k),'Color') is called in for cycle for each line and scatter object in axes. Inside the corrplot it is also called for all axes, which is slow. However, when you first set the color to any given value, internal optimization makes it much faster. I chose [0 0.4470 0.7410], because it is a default color for plotmatrix and corrplot and this setting doesn't change a behavior of corrplot.
Suggestion for a better solution: Add the line of code set(hS,'Color',[0 0.4470 0.7410]) to the function plotmatrix. This will make not only corrplot faster, but also any other possible combinations of plotmatrix and get functions called like this:
h = plotmatrix(A);
% set(h,'Color',[0 0.4470 0.7410])
for k = 1:length(h(:))
get(h(k),'Color');
end
How to Simulate a Synchronous Compensator in Simulink?
Write a matlab script that will print the odd numbers, 1 through 20, in reverse.
I cannot figure out how to do this correctly, please help.
Hello, all!
This is my first post after just joining this discussion, so please forgive me and provide kind assistance if I have posted to the wrong subsection!
I have a good interest in learning sql server course and right now I am taking help from various platforms like https://www.coursera.org/ https://www.udemy.com/
Also I have a doubt that is it a good option to learn from platforms like this or I should go for some sql server online training . I have searched for the solution of my queries in various above platforms which helped me up to some extent only as it was not directly given by any expert or trainer.
Hoping in getting a quick response
Thankyou in advance.
Hello, I am a student and I am working on a neural network for a line follower car and I would like you to recommend a tutorial to implement it in simulink.
I think it would be a really great feature to be able to add an Alpha property to the basic "Line" class in MATLAB plots. I know that I have previously had to resort to using Patch to be able to plot semitransparent lines, but there are also so many other functions that rely on the "Line" class.
For example, if you want to make a scatter plot from a table with things specified into groups, you can use ScatterHistogram or gscatter but since gscatter uses the Line class, you can't adjust the marker transparency. So if you don't want the histograms, you are stuck with manually separating it and using scatter with hold on.
The title is resonably non-descript, but I can explain it easily:
Say I have an initial Emax model:
v = emax1*[G]^n1/(ec501^n1+[G]^n1)
And I want to place v inside of a second Emax model:
y = emax2*v^n2/(ex502^n2+v^n2)
Currently, I have the full function of v inside y, twice, it's very long and whilst I only need to get it correct once, for readability in the future I'd rather have it in form #2. I've played around with non-constant parameters but I need the steady state to be v, not the rate rule, and I haven't worked out how to make a parameter shift to a form like v, as an observation might.
Are there any recommended solutions or do I simply need to keep with having v fully expressed in y?
Thank you,
Dan