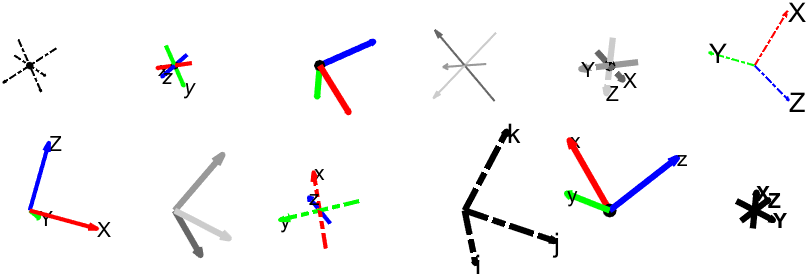
plotframe: Plot a 3-D Cartesian coordinate system
hg = plotframe( rotationMatrix, translationVector, basisVectorLengths, Name=Value )

Ahora está siguiendo esta publicación
- Verá actualizaciones en las notificaciones de contenido en seguimiento.
- Podrá recibir correos electrónicos, en función de las preferencias de comunicación que haya establecido.
Citar como
George Abrahams (2023) (https://www.linkedin.com/in/georgeabrahams). plotframe: Plot a 3-D Cartesian coordinate system (https://github.com/WD40andTape/plotframe/releases/tag/1.0.0), GitHub. Retrieved December 14, 2023.
Información general
- Versión (664 KB)
-
 Ver licencia en GitHub
Compatibilidad con la versión de MATLAB
- Compatible con cualquier versión desde R2020b
Compatibilidad con las plataformas
- Windows
- macOS
- Linux
| Versión | Publicado | Notas de la versión | Action |
|---|---|---|---|
| 1.0.2 | See release notes for this release on GitHub: https://github.com/WD40andTape/plotframe/releases/tag/1.0.2 |
||
| 1.0.1 | See release notes for this release on GitHub: https://github.com/WD40andTape/plotframe/releases/tag/1.0.1 |
||
| 1.0.0 |
Para consultar o notificar algún problema sobre este complemento de GitHub, visite el repositorio de GitHub.
Para consultar o notificar algún problema sobre este complemento de GitHub, visite el repositorio de GitHub.

