Fuzzy Inference System Walkthrough | Fuzzy Logic, Part 2
From the series: Fuzzy Logic
Brian Douglas
This video walks step-by-step through a fuzzy inference system. Learn about concepts like membership function shapes, fuzzy operators, multiple-input inference systems, and rule firing strength.
Published: 17 Aug 2021
In the last video, we covered an overview of a Fuzzy inference system, and the basic mechanics of how it all works. In this video, I want to continue that discussion by walking through a slightly more complex example, because it's going to allow us to talk about some important concepts that we missed in the last video-- namely, membership function shapes, Fuzzy operators, multiple input inference systems, and rule firing strength. So I hope you stick around for it. I'm Brian, and welcome to a MATLAB Tech Talk.
For this video, we're going to look at a Fuzzy inference system that determines how much you should tip at a restaurant given two inputs-- food quality and service quality. Now, you might be thinking that this is a rather silly example, but as we go through it, keep in mind that the steps that we take and the understanding we get from walking through this problem will help you solve other Fuzzy logic-based problems, whether you're designing a Fuzzy controller or any other decision-making process.
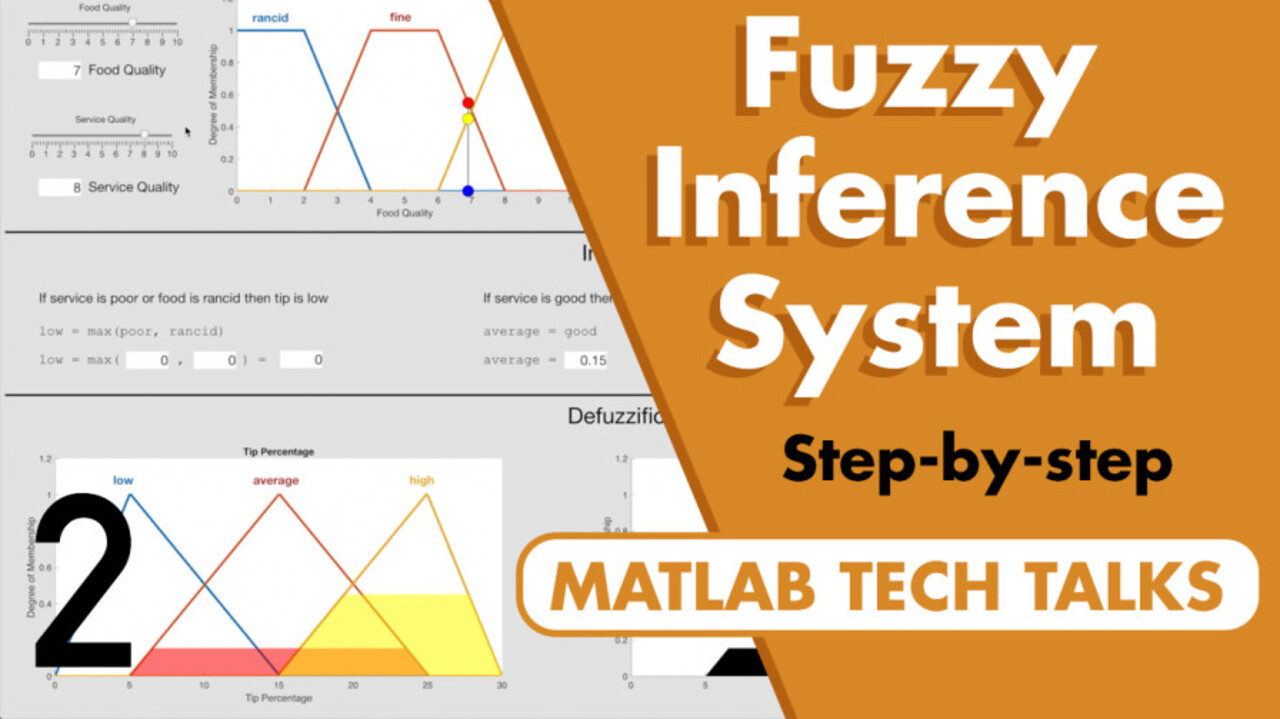
OK, to walk through this example, I created a simple app in MATLAB to visualize each of the steps in the inference process. And like we did before, we're going to break this problem up into three distinct sections-- fuzzification, inference, and defuzzification. So let's start with fuzzification.
We have two crisp inputs into the system-- food quality and service quality-- and they range from 0 to 10. And we can think about it like a feedback card at a restaurant. How was your service? How was your food, rated 0 to 10?
And to fuzzify these two values, we use the linguistic variables-- those are the human interpretable adjectives-- and their respective membership functions. So in this example, food is described as delicious, fine, and rancid, and the membership functions for each are described by these three trapezoidal functions.
And remember-- one way to get membership function shapes like this is to poll hundreds of restaurant-goers and ask them what range of numbers they think represent rancid food, and what range is fine food, and what range is delicious food. And since everyone will have a slightly different definition of these terms, we're going to get these overlapping membership functions where a specific value could be a partial member to multiple functions. Like here, food quality of 7 is 45% delicious and 55% fine.
Service quality also has membership functions. Here, I'm modeling the three adjectives of poor, good, and excellent with Gaussian functions. And choosing the shape of the membership functions comes down to trying to match the real distribution of the definitions of these adjectives.
Here I'm just claiming that maybe we polled a bunch of people and just tried to fit the best curve to it. However, in many cases, the shapes of these functions are determined through experience and expertise of the problem. If we go over to the MATLAB documentation for membership functions in the fuzzy logic toolbox, you can see that there are many different shapes that you can choose from to create the membership function that you need. Again, for this example, I'm using trapezoidal functions for food quality, and Gaussian for service quality.
All right, so back at our problem. We have our two crisp inputs. And if you recall from the last video, we can go from a crisp input to a fuzzy variable by determining the degree of membership in these functions for each input.
Like we said earlier, the fuzzified food quality of 7 becomes 0.45, 0.55, and 0, and the fuzzified service quality for, let's say, 8 becomes 0.38, 0.15, and 0. With these two fuzzified variables, we can move on to inference, or using logical statements to infer what the output should be.
In this case, we have three logical statements. If service is poor or food is rancid, then tip is low. If service is good, then tip is average. And if service is excellent or food is delicious, then tip is high. And these logical statements are similar to what we did in the last video, but with one major difference. We now have to deal with logical operators, like and, not, and, in this case, or. So let's talk about fuzzy logic operators.
Fuzzy logic operators are analogous to their binary counterparts. If we look at a binary or, it has the following truth table-- 0 or 0 become 0, since neither of them are 1. And the other three input combinations result in a 1, since at least one of the inputs is a 1.
You can see that one way we could calculate the result of a binary or is with the maximum function. The output is always the maximum of the two inputs. And the good thing about using a maximum function like this is that it works when the two input variables are not a binary 1 or 0, but rather fuzzy variables that can range between 0 and 1.
So as an example, if we or the two fuzzy variables 0.2 and 0.8, then the result is the maximum, or 0.8. Since at least one of these inputs is relatively large, the output of the or is also relatively large. And similarly, if we have two low-degree memberships, like 0.2 and 0.1, then the output will also be low.
Now, we don't have an and or a not operator in our problem, but let's talk about them anyway. Here is the truth table for a binary and, and for a binary not. And we can calculate them respectively with a minimum function, and with 1 minus the input. Therefore, a fuzzy and just becomes the minimum function of the two input variables, and a fuzzy not is just 1 minus the input variable.
Now, there are other ways to define fuzzy operators than these three that I've presented. Other ways include T-norms, or triangular norms, and their counterparts, T-conorms. On Wikipedia there's some nice graphics that visually show what these different norms are doing.
For example, the minimum T-norm produces this 3D contour. Notice that as long as one of the inputs is 0, then the output is 0. And if both inputs are 1, then the output is 1-- which is exactly the binary and. But with this minimum function, you can see what the output would be for any values for the two fuzzy inputs.
Similarly, instead of minimum, if we use the product T-norm for a fuzzy and, then the 3D contour would look like this. The four binary conditions of 0 0; 1, 0; 0, 1; and 1, 1 each produce the expected output for a binary and, but in between, the fuzzy variables would produce slightly different values than the minimum function. So as you can probably imagine, there are many different ways to define each of the fuzzy operators, and they'll each produce slightly different results. However, for this video, I'm going to stick with max, min, and 1 minus the input to represent or, and, and not.
OK, back to our problem. Our three statements become the following mathematical equations. Low is the maximum of poor and rancid. Average equals good, and high is the maximum of excellent and delicious.
And for the inputs, food quality of 7 and service quality of 8, we get low is 0, average is 0.15, and high is 0.45. These values are the rule firing strengths. That is, they represent how much each particular rule impacts the final output.
And this might not be too impressive with just three rules, but it becomes really important for systems that have a couple dozen rules-- or more-- because viewing the rule firing strengths can help you understand which rules have the largest impact, which is helpful for troubleshooting, or just understanding your system.
So if we go back to the simple flowchart that we developed in the first video, the rule base in this inference step uses the rule firing strength for fuzzy logical implication of the output variables. So fuzzification works on the input variables, and then the rule base implies the output variables.
All right, so we have a fuzzy variable indicating how much tip we should leave. That is, what degree of low, average, and high should the tip be? And in this case, it's 0.15 and 0.45. And to get this fuzzy variable back into a crisp tip value-- a very specific amount-- we need to defuzzify it. And once again, we need the membership functions for the tip adjective to do this. And to keep with my theme of showing different membership function shapes, I choose triangles for this one.
A low tip ranges between 0% and 15%, average is 5% to 25%, and high is 15% to 30%. Now we can use the degree of membership in each one of these functions to determine the tip percentage with defuzzification. And I said in the last video that there are many ways to defuzzify a fuzzy number, and in the MATLAB documentation, you can see a handful of methods that the fuzzy logic toolbox software supports, including the popular centroid method, which is what I'm going to use for this tipping problem.
And let me quickly reiterate what the centroid method is. We can fill each output membership function based on the degree of membership that is stated in the fuzzy variable. So we don't fill the low membership function at all, since it has 0 degrees of membership. But we fill the average function up 15% from the bottom, and then we fill the high function 45% up from the bottom.
We then combine these filled areas into a single shape, and then the defuzzified number is the x-coordinate of the centroid of the shape. Or in other words, if you think of this area as a plate with uniform thickness and density, the centroid is the point along the x-axis about which the fuzzy set would perfectly balance. And in this case, that point is at 20.2%.
Now, if I change the inputs into this fuzzy inference system, you can start to get a feel for how the input membership sets change, which then affect the logical statements, which change the degree of membership in the output sets, which change the centroid location, changing the output value.
Look at this one where the food is perfectly delicious, but the service quality was abysmally poor. So these two conditions average out, and the tip is exactly the average amount of 15%. And notice that with the centroid method, the absolute lowest output possible is the centroid of the lowest membership set, which, in this case, is 6.8%. And the highest possible output is the centroid of the highest membership set, which is 23.2%. And this is important to note, because if you were expecting the output to have a range of 0% to 30%, then you would need to adjust these membership functions to account for that by making them a little bit wider.
OK, so what we've created here is a mapping between the two input variables and the one output variable, and that mapping is fixed and deterministic given these particular membership functions and these rules. So theoretically, we could systematically cycle through every single input combination and determine what the output is.
For example, the inputs 0.1 and 0.1 produce a tip of 6.8%, so I can just put that value in this 3D graph. And then the next set of inputs of 0.1 and 0.4 also produce a tip of 6.8%, and I put that point in the graph. Moving on to 0.1 and 0.7 produces a tip of 7%. Now we can just continue cycling through all of the possible combinations of food quality and service quality across their entire range, and produce this set of points that describe the input/output relationship for this inference system.
So that's pretty cool, but instead of this discreet set of points, we can see that this can be defined by a continuous 3D surface. So given a food quality and service quality input, we can use this service to look up what the tip output should be. And rather than run the whole fuzzy inference system real time on your target processor over and over again each sample time, we could replace this entire system with a simple lookup table that is governed by this surface. It would essentially just use the x and y-coordinates from the inputs to look up the output tip value.
And replacing a fuzzy inference system with a lookup table like this might be beneficial if you want to run this function on a microcontroller that is computationally limited. A lookup table requires much fewer computations to execute than fuzzifying the inputs, performing inference, and then defuzzifying them, which is great. And as I will show you shortly, this control surface can be generated quite easily with the gensurf function in MATLAB.
However, there is a downside with lookup tables, because we lose the benefit of the human interpretable rules that created this surface. And so even if you deploy a lookup table to your processor, it's beneficial to maintain the fuzzy inference system offline and use it as the source for changes to the system.
For example, let me show you how easy it is to update the rules in our tipping function. Now, instead of using the rather clunky app that I wrote, I recreated it with a MATLAB script. The first part defines the input and output membership functions in the exact same way that we had them before.
You can see that the service functions are Gaussian, the food functions are trapezoidal, and the tip functions are triangular. In the inference section, you can see that I've defined the exact same three rules as well. And now I can generate that input/output mapping that we did before with the gensurf function. And as you can see, it looks like what we created by manually cycling through the inputs.
Now let's say that I want to change this system by adding a fourth rule that says that if food is fine, then tip is high. Basically, I'm saying that the food is the most important thing, and if it's fine, then I'm happy to tip a high amount-- no matter what the service was like. And if I add that rule to my inference system and generate the new surface, you can see that the mapping has changed. The center portion around the fine food area has been raised, just as we would have expected. And it's this easy and intuitive creation and manipulation of fuzzy inference systems that make them so powerful.
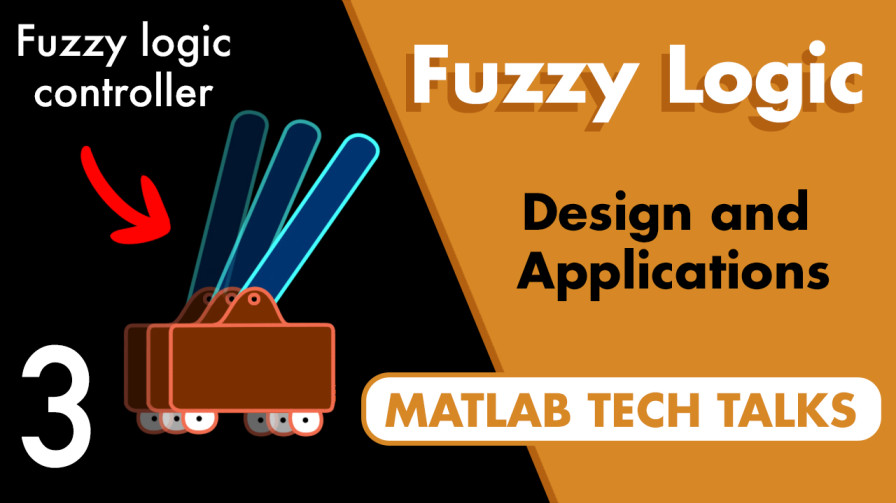
Now, I know I said that this example was silly, but we can use this to do so many other things. For example, this is a fuzzy controller that can balance a pole on top of a moving cart. It's the classic inverted pendulum problem, but this time the parameters of the controller are generated in the form of membership functions and fuzzy logic rules, rather than PID or some other controller. And we're going to talk more about this inverted pendulum problem, as well as other practical fuzzy logic applications in the next video.
So if you don't want to miss that or any other future Tech Ta;k videos, don't forget to Subscribe to this channel. Also, if you want to check out my channel, Control System Lectures, I cover more control theory topics there as well. Thanks for watching, and I'll see you next time.


Seleccione un país/idioma
Seleccione un país/idioma para obtener contenido traducido, si está disponible, y ver eventos y ofertas de productos y servicios locales. Según su ubicación geográfica, recomendamos que seleccione: United States.
También puede seleccionar uno de estos países/idiomas:
América
- América Latina (Español)
- Canada (English)
- United States (English)
Europa
- Belgium (English)
- Denmark (English)
- Deutschland (Deutsch)
- España (Español)
- Finland (English)
- France (Français)
- Ireland (English)
- Italia (Italiano)
- Luxembourg (English)
- Netherlands (English)
- Norway (English)
- Österreich (Deutsch)
- Portugal (English)
- Sweden (English)
- Switzerland
- United Kingdom (English)