Comparing and Saving Simulation Data | Getting Started with Simulink, Part 5
From the series: Getting Started with Simulink
Use the Simulation Data Inspector in Simulink® to compare the results of multiple simulation runs. This lets you optimize the performance of your model, as it allows you to compare how changes in block or model parameters affect the behavior of your system. Open the results in MATLAB Figures to further annotate and add information to your figures.
Published: 23 Oct 2017
Now let's go back--
Yeah. Let's go back to Simulation Data Inspector, right?
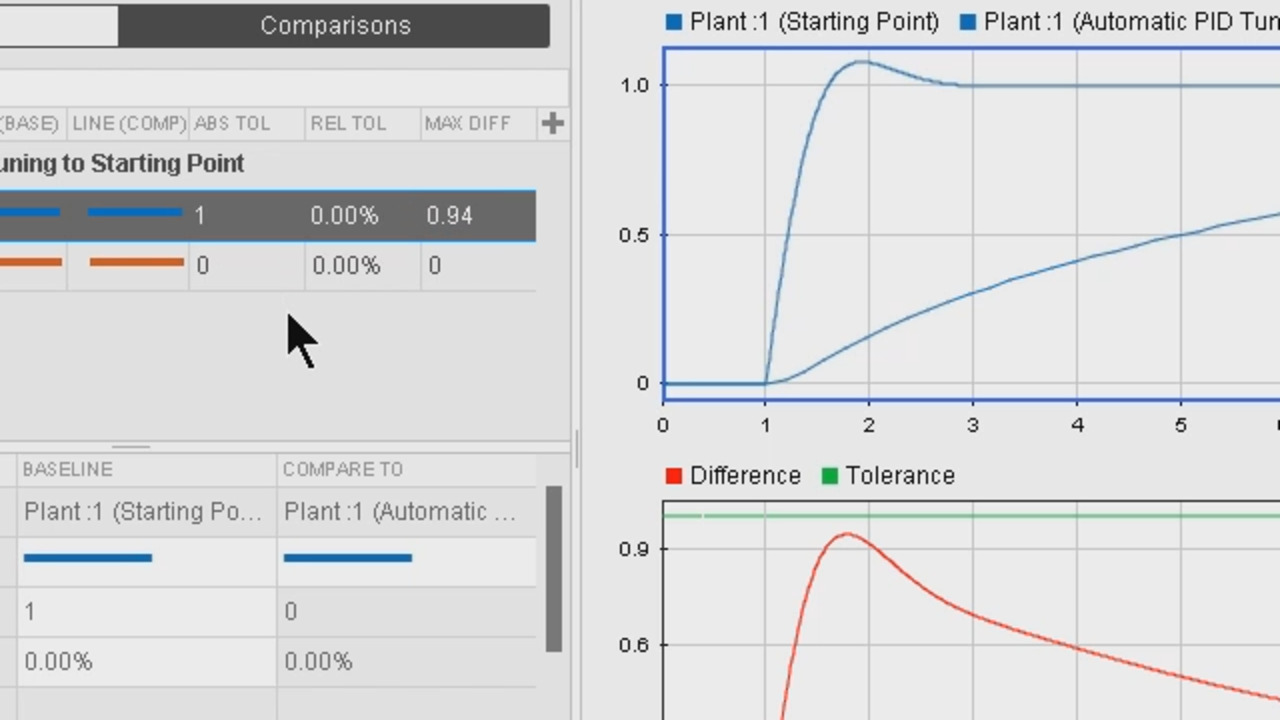
Yeah. So we ran the simulation a couple of times already. One time, we used manual, but this time, we used automatic PID. So I'll rename the automatic PID Tuning as just a reference for my sake. And I compare my baseline-- using this Compare tab-- my baseline as the starting point. And I'm going to compare it with the automatic PID tuning that I have done.
OK.
I can compare these two simulation runs. And it will visually show me how the signals are different and the difference between the values of the signal on the bottom half.
OK. So for here, it's showing you that clearly we had different response signals between the starting point of 555 and then the automatic. And it's telling you the difference is about 0.9. And you could set a tolerance--
Right.
--when you're doing these differences. So by default, it's this 0, which is why you're getting that x over there on the left because it's out of tolerance.
Right.
So, I guess, for this example, we expected the results to change, so obviously, we're going to be out of tolerance. But I think one of the reasons why people use this comparison tool is, let's say you have a model-- you want to look at changing some parameters to maybe optimize the performance, but you don't want the actual results to change.
Right.
And you just want to make sure that the changes that you make don't significantly change the desired response. You can do this comparison in here and make sure that everything is staying within tolerance.
Everything looks fine. Yeah, exactly. And these tolerance-- these fields are editable. So you can--
So if you change that to, say, 1.
--if you want strict tolerance-- if I change it to 1, this should turn back to and run compare again, they should turn green because our difference is only 0.94.
Yeah. Right. OK.
So that's what it is. Sometimes, you just want the output to be same like Michael just mentioned. And in that case, you could set a tolerance and check for the results.
Yeah. And you can match it in your model. And this is only two signals, right?
Yes.
Most likely, you're going to be interested in more than two signals in your own models. And it'll just track all of those comparisons here in one spot.
In one spot. Yeah.
Yeah.
And in addition, you can also send these results to MATLAB Figures.
Oh, so if you click on that, it'll just open up a MATLAB Figure.
Yeah. And I can try doing that. And that will be a MATLAB Figure. Here, you can basically add additional information like titles and so on.
Sure.
And I don't know. I mean, you can do additional data manipulations right here.
It's nice being able to go from this tool to MATLAB Figure because a lot of people are used to working with MATLAB Figure.
Exactly. Yeah.
So whatever you're comfortable with.
Yeah. Instead of pulling the simulation data and then plotting it by yourself, writing code and doing that, you can automatically create figures from here.
So what if you do want to store all this data, though?
Yes.
It's pretty easy to do that, I think.
Yeah. So you can save this data right from the menu items here. Oops, it's just creating multiple windows because it's loading, I guess. And so I can create comparison data MAT file. It's stored as a MAT file.
And as you can see, this now becomes a MAT file, which is being represented within Simulation Data Inspector. So when I close MATLAB, come back tomorrow, and want to continue with my analysis, I can simply load that MAT file using the Simulation Data Inspector, and then I'll be able to compare those.
Yeah. And what's nice, it also showed the same views that you were looking at before. So it'll open it up in the exact spot that you were in the last time. So you could literally continue from where you left off.
Exactly. So that's the benefit of Simulation Data Inspector. It goes one step beyond visualizing. It helps you compare and do additional analysis right from the UI itself.


Seleccione un país/idioma
Seleccione un país/idioma para obtener contenido traducido, si está disponible, y ver eventos y ofertas de productos y servicios locales. Según su ubicación geográfica, recomendamos que seleccione: United States.
También puede seleccionar uno de estos países/idiomas:
América
- América Latina (Español)
- Canada (English)
- United States (English)
Europa
- Belgium (English)
- Denmark (English)
- Deutschland (Deutsch)
- España (Español)
- Finland (English)
- France (Français)
- Ireland (English)
- Italia (Italiano)
- Luxembourg (English)
- Netherlands (English)
- Norway (English)
- Österreich (Deutsch)
- Portugal (English)
- Sweden (English)
- Switzerland
- United Kingdom (English)