Biopipeline Designer
Description
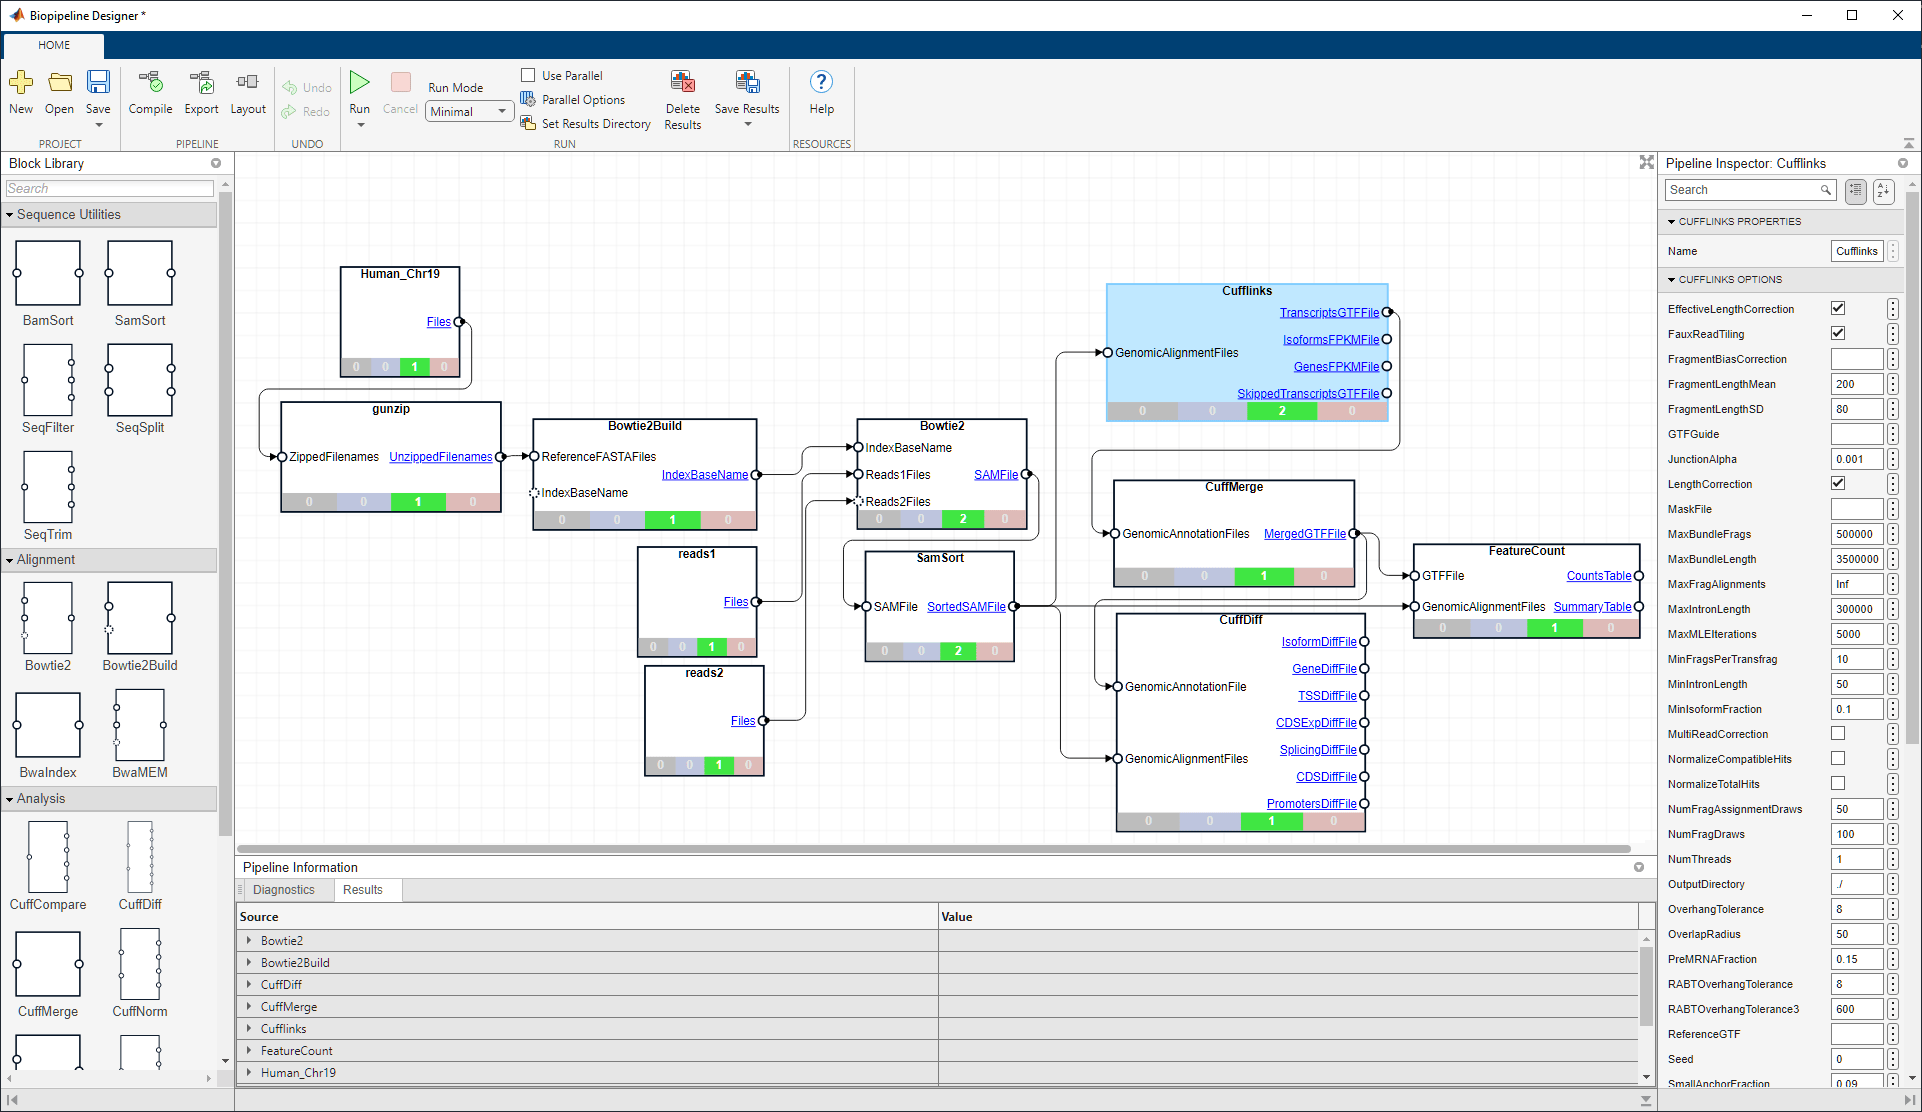
The Biopipeline Designer app lets you build and run end-to-end bioinformatics workflows interactively. It provides a block diagram editor to build the pipeline using built-in or custom blocks, where each block is a step that is needed in your workflow to reach the final goal of your analysis. For example, the goal could be to identify differentially expressed genes from RNA-Seq data. Some of the steps needed for such analysis could be preprocessing of read count data and counting genetic features, and you can define individual blocks to perform these necessary steps and connect such blocks to form a complete pipeline.
Using the app, you can create various bioinformatics pipelines to analyze genomic data. For instance, you can:
Filter read sequences based on some criteria, such as read quality or length.
Map reads to a reference using the built-in
Bowtie2andBwaMEMblocks.Count the number of reads mapped to genomic features.
Assemble transcriptomes, quantify transcript expression profiles, and identify significant changes in transcript expression using
Cufflinks,CuffQuant,CuffDiff, and other related blocks.Create a custom block to represent any arbitrary MATLAB® function and use in your pipeline, such as for performing differential analysis on RNA-seq count data or plotting the analysis results.
Open the Biopipeline Designer App
MATLAB Toolstrip: On the Apps tab, under Computational Biology, click the app icon.
MATLAB command prompt: Enter
biopipelineDesigner.
Examples
This example shows how to create a bioinformatics pipeline in the Biopipeline Designer app that loads sequence read data, filters some sequences based on quality, and displays the quality statistics of the filtered data.
The example provides individual steps to build the pipeline from the beginning. To open the same completed pipeline, open the app. Then select Open > Open Example Pipeline > Plot Sequence Quality Data.
Open Biopipeline Designer App
Enter the following at the MATLAB® command line.
biopipelineDesigner
Select Input File Using FileChooser Block
In the Block Libraries panel of the app, scroll down to the General section. Drag the FileChooser block onto the diagram.

You can also use the Search box to look for specific built-in blocks in the Block Libraries.
Double-click the block name FileChooser_1 and rename as FASTQ.

Run the following command at the MATLAB command line to create a variable that contains the full file path to the provided sequence read data.
fastqFile = which("SRR005164_1_50.fastq");
In the app, click the FASTQ block. In the Pipeline Inspector pane, under FileChooser Properties, click the vertical three-dot menu next to the Files property. Select Assign from workspace.

Select fastqFile from the list. Click OK.

Disable SplitDimension Icons Display
By default, the app displays dedicated icons for the split dimension settings of the input ports of your pipeline blocks. For the purposes of the example, disable the icon display. For more details about the icons and their meanings, see Show split dimensions in Biopipeline Designer.
Right-click in an empty area of the diagram and clear Show split dimensions icons. It would look as follows afterwards.

Filter Sequences Based on Quality
In the Block Libraries panel, under the Sequence Utilities section, drag the SeqFilter block onto the diagram. This block can filter sequences based on some specifications. The Pipeline Inspector panel shows the default values of the block properties and filtering options. In the SeqFilter Options section, change Threshold to 10,20. Keep the other options as default. This 10,20 threshold value filters out any sequences with more than 10 low quality bases, where a base is considered low quality when its quality score is less than 20. For details, see SeqFilterOptions.

Plot Sequence Quality Data
Create a custom (bioinfo.pipeline.block.UserFunction) block that calls an existing MATLAB function seqqcplot to plot the quality statistics of the filtered data.
In the Block Libraries panel, under the General section, drag and drop the UserFunction block onto the diagram.
Rename the block to SeqQCPlot.
In the Pipeline Inspector pane, under UserFunction Properties, set the RequiredArguments to
inputFileand Function to seqqcplot.

Connect Blocks and Run Pipeline
After setting up the blocks, you can now connect them to complete the pipeline.
Drag an arrow from the Files output port of FASTQ to the FASTQFiles port of SeqFilter_1.

Next connect the FilteredFASTQFiles port to inputFile port.

On the toolstrip of the app, click Run. During the run, you can see the progress of each block at its status bar. Point to a color-coded section with a number to see its meaning.

After the run, you can click each output port name of a block to see the output value. For example, click NumFilteredOut to see the total number of reads that were filtered out by the block.

The app generates the following figure, which contains quality statistics plots of the filtered data.

If there are any errors or warnings, the app shows them in the Diagnostics tab of the Pipeline Information panel, which is at the bottom of the diagram.

Click the Results tab. In the Source column, expand SeqFilter_1 to see the block results, such as the filtered FASTQ file and the number of sequences that are selected and filtered out.

Rerun Pipeline with Different Filtering Threshold
You can specify a different threshold to filter sequences and rerun the pipeline. The app is aware of which blocks in the pipeline have changed and which other blocks, such as downstream blocks, are affected as a result. Hence, on subsequent runs, it reruns only those blocks that are needed, instead of every block in the pipeline. For details, see Bioinformatics Pipeline Run Mode.
Click SeqFilter_1. In the Pipeline Inspector panel, change its Threshold option to 5,20. This setting now filters out any sequence with more than 5 low quality bases, where a base is considered low quality when its score is less than 20. Both SeqFilter and SeqQCPlot blocks now have a warning icon to indicate that the results are now out of date due to the change to the SeqFilter block.
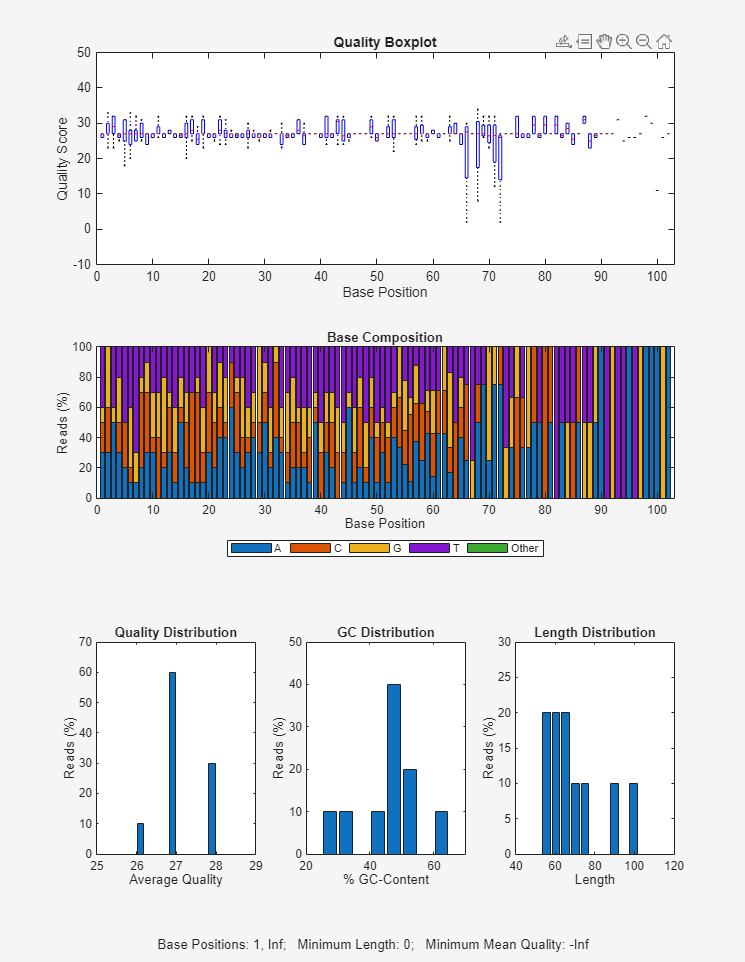
Click Run. The app generates the following figure. During this run, the app does not rerun the FASTQ block because it is not needed. It only reruns the other two blocks.

Go to the Results tab of the Pipeline Information to check the new results.

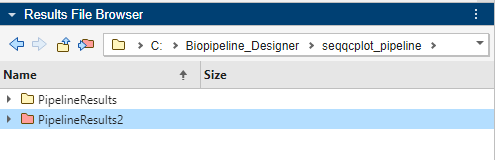
Navigate, View, and Access Output Files in Results File Browser
By default, the app saves the pipeline results in the PipelineResults folder in the MATLAB current folder. In this example, the current folder is C:\Biopipeline_Designer\seqqcplot_pipeline\ and the pipeline results folder is C:\Biopipeline_Designer\seqqcplot_pipeline\PipelineResults\ as shown in the Results File Browser pane.

The Results File Browser pane allows you to navigate, view, and access the output files generated by the pipeline. You can expand the results folder for each block to view the corresponding output files.
Expand SeqFilter_1 > 1 to see the FASTQ file containing the output sequences of the SeqFilter_1 block.

Click the up arrow ![]() to go up one folder. The app uses a red folder to indicate the current results folder.
to go up one folder. The app uses a red folder to indicate the current results folder.

Clicking the Go To Results Folder button takes you directly to the current results folder if you are not in it.
You can use the context (right-click) menu for additional options. For instance, create a new folder and set it as the new results folder. Right-click within the Results File Browser and select New Folder.
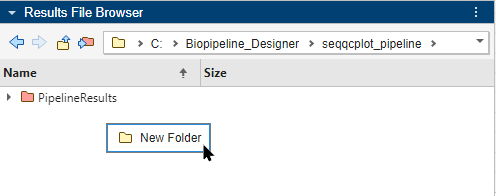
Click the folder once to rename it as PipelineResults2. Right-click the folder and select Set As Results Folder.
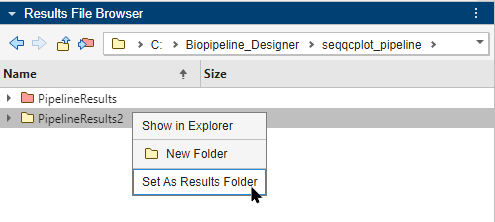
The color of PipelineResults2 is changed to red to indicate that PipelineResults2 is the current results folder, and the Results Folder row shows the newly-set results folder. The app saves any subsequent pipeline results in this folder.
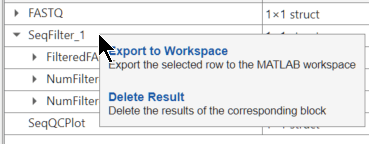
Export Results
You can export each output of a block or every output of a block to the MATLAB workspace by selecting Export to Workspace from the context (right-click) menu of the corresponding row in the Results table. To export all outputs of a block, right-click at the block level.
Open Biopipeline Designer
Open the app by entering the following command.
biopipelineDesigner
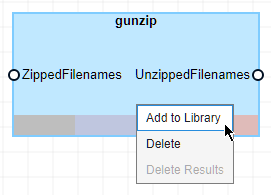
Create Custom Block
Create a custom (bioinfo.pipeline.block.UserFunction) block that calls an existing MATLAB function gunzip to unzip data. You can save such a block in a custom library and reuse the block in different pipelines.
First, in the Block Library panel, under the General section, drag and drop the UserFunction block onto the diagram.

Double-click the block name UserFunction_1 and rename it as gunzip.
In the Pipeline Inspector pane, under UserFunction Properties, set the RequiredArguments to ZippedFilenames, Function to gunzip, and OutputArguments to UnzippedFilenames. To use this block in your pipeline, set the value of ZippedFilenames as the names of zipped files or connect to the output of a FileChooser block.

For example, to download and unzip the file Homo_sapiens.GRCh38.dna.chromosome.19.fa.gz from the web that contains the human reference genome chromosome 19, you can set the ZippedFilenames.Value property to the url of the file: http://ftp.ensembl.org/pub/release-104/fasta/homo_sapiens/dna/Homo_sapiens.GRCh38.dna.chromosome.19.fa.gz

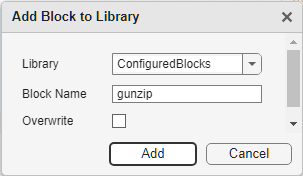
Add to Block Library
You can save such a configured block in a custom library. Right-click the gunzip block and select Add to Library.
In the Add Block to Library dialog, specify the library name as "ConfiguredBlocks". The library and block names must be valid variable names.
The Overwrite option lets you overwrite any existing block with the same name in the same library. Leave it unchecked.
Click Add.
In the Block Libraries panel, a new library named ConfiguredBlocks with the block gunzip is added.

Revert to Default
You can revert the value of a block property to the default property value from the original library. This is useful when you want to reset the value of a configured block property back to the original value.
To do so, click the vertical three-dot menu next to the property of the block. Click Revert to default.

Remove Block From Library
You can also remove the blocks from any custom library that you have created and added. To remove a block from the custom library, right-click the block from the block library and select Remove from library.

Note that you can only remove custom blocks, but not the built-in blocks.
Related Examples
Programmatic Use
Version History
Introduced in R2023a