Profile STM32 Algorithms in Real-Time
This example shows how to use the Execution Profiler block to perform real-time execution profiling of algorithms with the Embedded Coder® Support Package for STMicroelectronics® STM32 Processors. The example demonstrates three profiling methods:
DWT Timer Based Profiling: Use the Data Watchpoint and Trace (DWT) unit profilier to measure precise execution times by recording cycle counts at the start and end of tasks.
Timer-Based Profiling: Use hardware timers to measure execution times by capturing timestamps before and after task execution.
GPIO-Based Profiling: Measure execution timing by toggling a GPIO pin at the start and end of a task and analyzing the resulting signal with external tools like such as an oscilloscope.
This example highlights how the Execution Profiler block minimizes overhead while delivering detailed execution-time insights for algorithm optimization.
Required Hardware
This example is preconfigured for the STM32G474RE Nucleo board. However, it also provides step-by-step instructions to perform profiling on any STM32 hardware with the necessary configurations.
Available Models
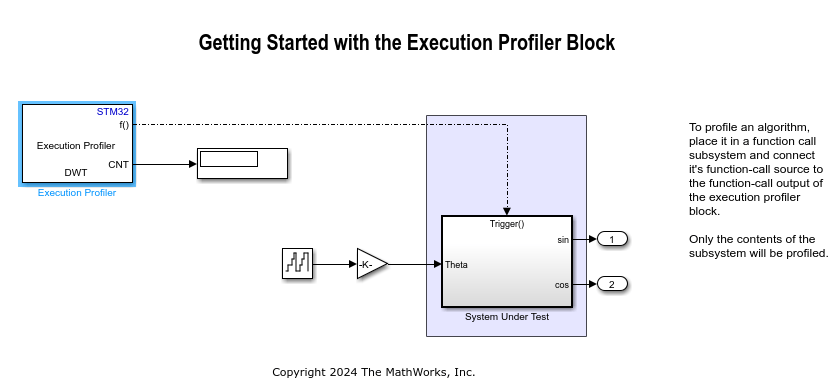
Use the stm32_getting_started_with_execution_profiler.slx model to generate code and profile the execution time of a function-call subsystem with the Execution Profiler block.
DWT Timer Based Profiling
Use the 32-bit timer in the Data Watchpoint and Trace (DWT) unit to measure execution time. The Execution Profiler block records the timer count at the start of the system under test (SUT) function-call subsystem execution. After execution completes, the block records the timer count again. The difference between these timestamps calculates the execution duration, which is then displayed for analysis.
Peripheral Configuration
Double-click on the block to open block parameter configurations. You can use the same parameter values if you want to run this example for other hardware boards.

Note: DWT is not supported for processors of type Cortex-M0 or Cortex-M0+.
Monitor and Tune Model
When you perform the Monitor & Tune action for the model, the host computer communicates with the target, on which the generated executable runs.
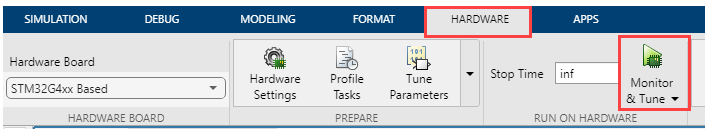
1. Open the Hardware tab and click Monitor & Tune. You can observe from the Diagnostic Viewer that the code is generated for the model and the host connects to the target after loading the generated executable.
2. While the model is running, observe the Display block to monitor the timer counts.
Timer-Based Profiling
Measure the execution time of an algorithm using a timer that you select. Similar to the DWT-based approach, the system captures timestamps before and after the SUT function-call subsystem execution. The time difference is calculated and displayed. This method allows flexible timer selection, enabling broader hardware compatibility.
Timer Configuration
Open the IOC file associated with your project in STM32CubeMX.
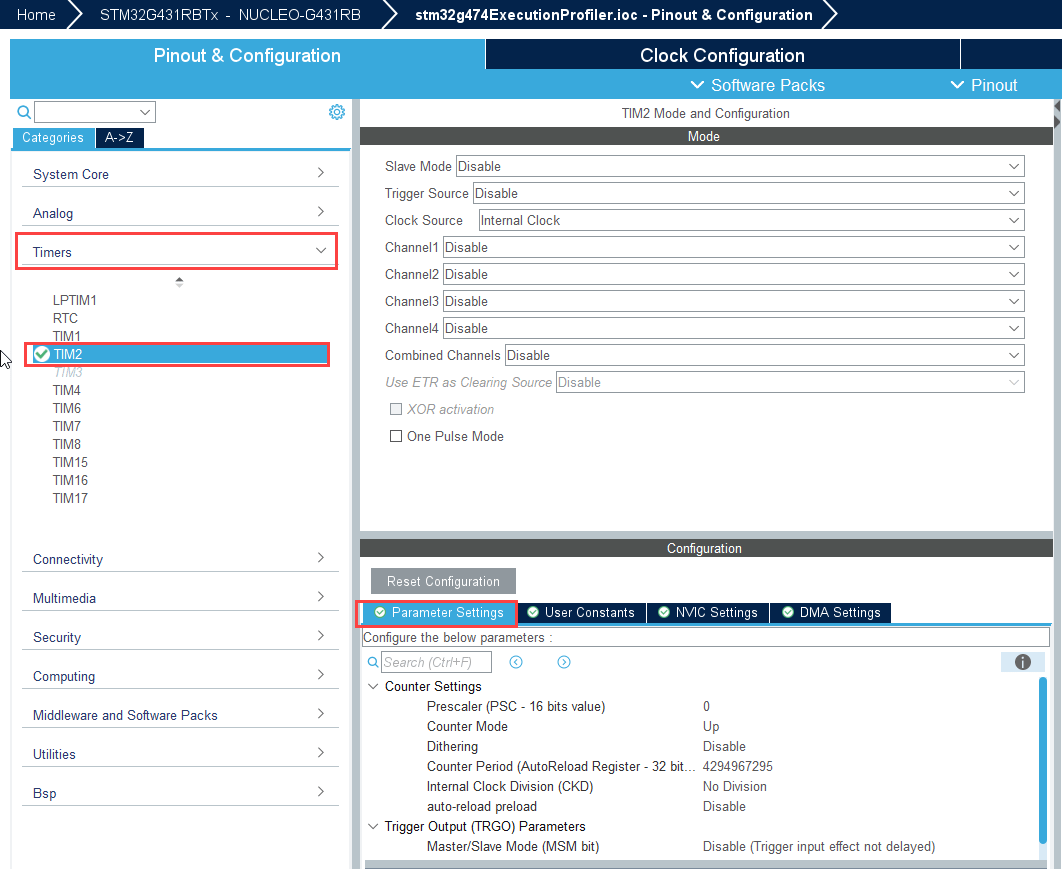
Use Timer 2 in the IOC file to capture counts for execution profiling.
Set the prescaler value to 0 and configure the counter period to the maximum 32-bit value as shown in the following figure.
A 32-bit timer is recommended for profiling longer tasks to avoid overflow issues. Using a 16-bit timer can result in inaccurate readings due to overflow.
If a 32-bit timer is assigned as the timebase source in the SYS tab, consider using a basic timer (such as Timer 6 or Timer 7) instead. Doing so reserves the 32-bit timer for profiling or other application-specific tasks, as the timebase source is mainly used for delays and timeouts that do not require advanced timer features.

USART Configuration
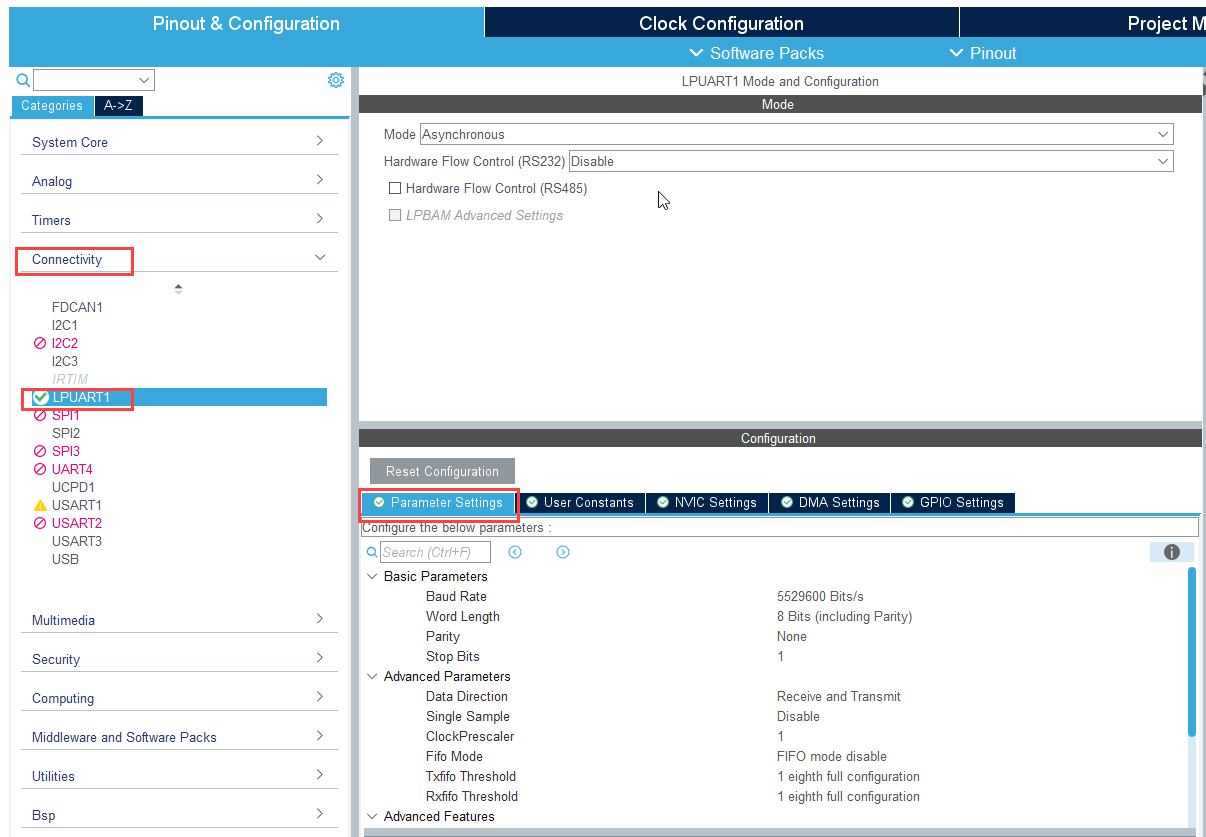
Configure a USART/UART module to enable serial communication for external mode. this example uses the LPUART1 module on the STM32G474RE Nucleo board.
Block Configuration
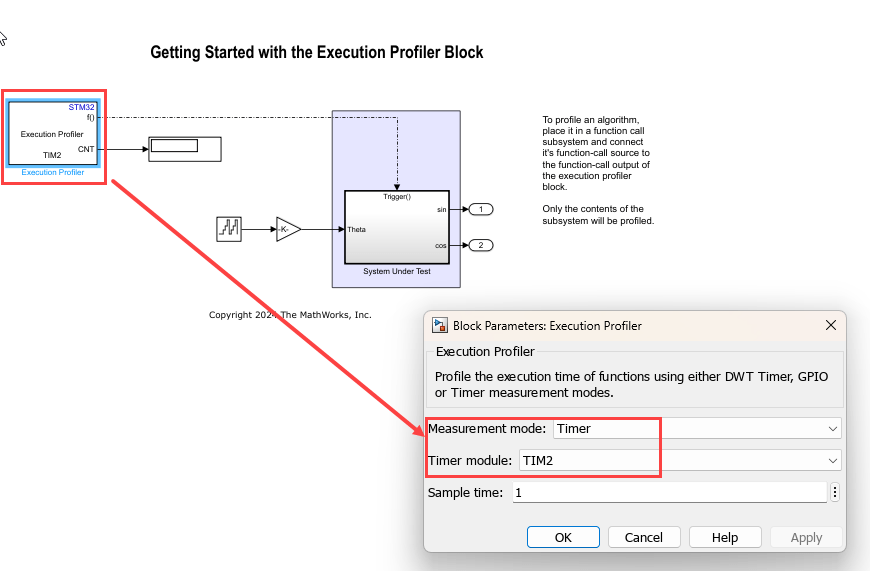
Monitor and Tune the Model
Execute the Monitor & Tune action for the model as explained earlier in the example, then observe the Display block to track the timer counts.
GPIO-Based Profiling
Use a GPIO pin to externally indicate execution timing. At the start of the SUT function-call subsystem execution, the selected GPIO pin is set high. Once execution completes, the pin is pulled low. An external device, such as an oscilloscope or logic analyzer, measures the high pulse width to determine execution time. This method is ideal for monitoring execution timing with external tools.
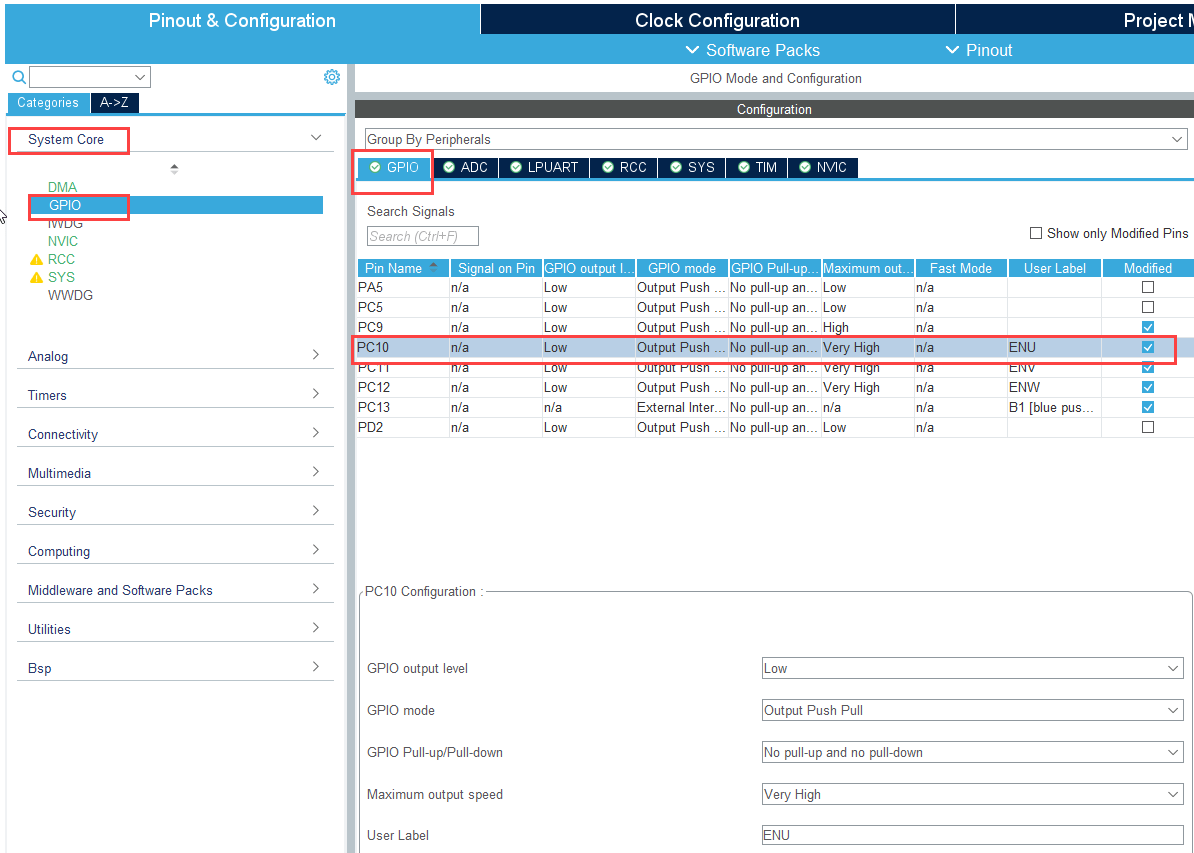
GPIO Configuration
Open the IOC file for your project in STM32CubeMX.
Select a GPIO pin based on your requirements and configure it as GPIO Output.
Set the Maximum Output Speed parameter to a higher value based on the the call rate of the subsystem.
Block Configuration
Configure the GPIO port name and pin number in the Execution Profiler block as shown.

Generate Code and Load on Hardware Board from Simulink Model
1. Press Ctrl+B or click Build, Deploy & Start to generate and deploy code for the model.
2. Open the Diagnostic Viewer from the link at the bottom of the model canvas to monitor the build process. After you load the code on the board, observe output signals on an oscilloscope.