Analyze Execution Times of Critical Paths
If your model contains conditional subsystems or blocks with decision conditions for execution, the code generated from the model can have multiple execution paths. The code execution path that produces the longest execution time for a task is called a critical path.
Tasks are entrypoints into the generated code that contain execution code for each step. During model development, you can profile the generated code to measure execution times and identify hotspots to determine if the execution times of the generated tasks meet your performance requirements. For more information, see Identify Hotspots in Generated Code. If the measured longest execution-time do not meet your performance requirements or your model contains complex execution paths, run a critical path analysis to identify the critical paths of the generated tasks and performance bottlenecks in them.
Use the coder.profile.test.analyzePath function to identify the critical path and
produce execution-time estimates in percentages through a software-in-the-loop (SIL) or
processor-in-the-loop (PIL) simulation for the identified path. By reviewing the
execution-time estimates in the Code Profile Analyzer, you can identify the most expensive
code sections. Identifying the path and expensive sections helps you focus your optimization
effort on that specific path. You can also create test cases for the corresponding path and
use the tests to acquire the longest execution times using the coder.profile.test.runTests function and identify the most demanding
tests.
Tests for Critical Path Analysis
To get reliable results from a critical path analysis, provide test cases that cover system requirements and all decision branches. You can use model inputs as test cases for the analysis. If the model inputs do not have sufficient coverage and you have a Simulink® Design Verifier™ license, use these functions for test generation:
coder.profile.test.generateTeststo generate decision coverage tests for your modelcoder.profile.test.generateCriticalPathTestto generate path coverage tests for the identified critical path
The functions generate test cases in the MAT and MLDATX files. Import the tests in the MAT file to the model as inputs and use those for the analysis. If you have a Simulink Test™ license, you can directly use the MLDATX test file.
Prerequisites of Critical Path Analysis
To run a critical path analysis, your model must meet these:
Your model must be compatible with your chosen simulation mode, either simulation-in-the-loop (SIL) or processor-in-the-loop (PIL) mode for execution-time profiling. For modeling constraints that apply to SIL and PIL simulations and execution-time profiling, see SIL and PIL Limitations and Tips and Limitations.
To generate test cases using the
coder.profile.test.generateTestsandcoder.profile.test.generateCriticalPathTestfunctions, your model must be compatible with Simulink Design Verifier.Manually created test cases must be imported to the model as inputs. For more information on importing data into a model, see Overview of Signal Loading Techniques.
Analyze Critical Paths of Generated Code
This example shows how to run a critical path analysis to identify the critical path of the generated code and performance bottlenecks in it.
Example Model
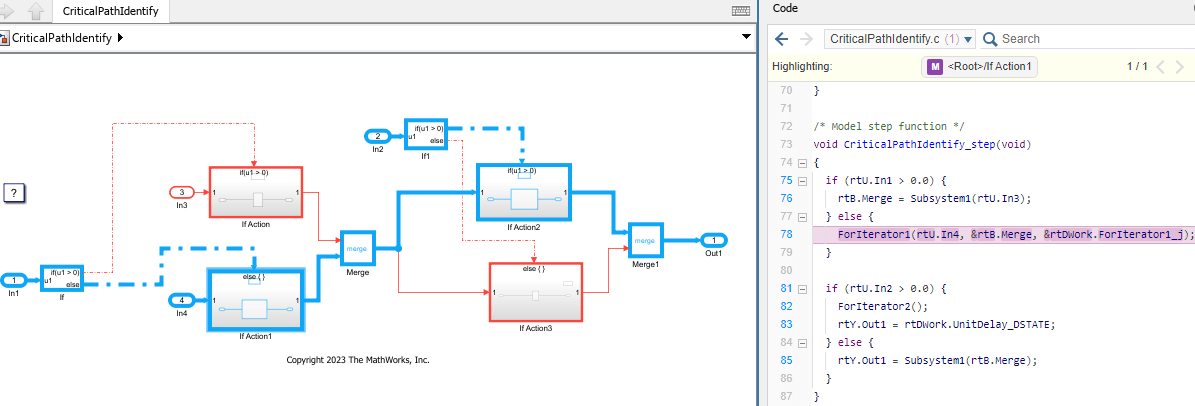
Open the example model CriticalPathIdentify.
model = 'CriticalPathIdentify';
open_system (model);
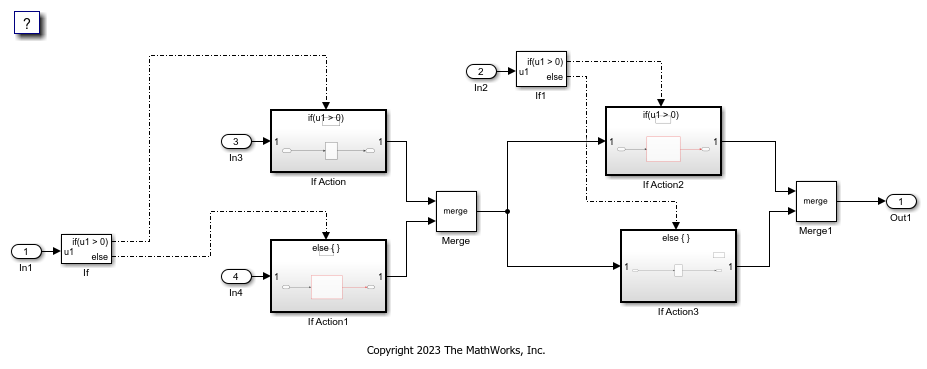
The model contains the If Action Subsystems If Action, If Action1, If Action2, and If Action3, whose executions are controlled by the If blocks If and If1. The If block evaluates the logical expression u1 > 0 and selects If Action or If Action1 for execution. Similarly, the If1 block selects If Action2 or If Action3 for execution. Conditional execution of the subsystems introduces multiple execution paths for the model. The code generated from the model implements the paths using conditionally executed statements.
The model is single rate and configured for single-tasking by clearing the model configuration parameter Treat each discrete rate as a separate task. Assume that you produced execution-time profiling for the code generated from the model and the measured longest execution times of the task do not meet your performance requirements. In this example, you run a critical path analysis.
Identify Critical Path of Generated Code
To identify the critical path in the generated code, use the
coder.profile.test.analyzePath function. For this example, use the
model inputs as test cases and a software-in-the-loop (SIL) simulation for the analysis.
The model inputs are stored in the MATLAB (base) workspace and using the root-level input
ports, those signals are
loaded.
analysisResults = coder.profile.test.analyzePath(model, SimMode='SIL');coder.profile.ExecutionTimeSet object,
analysisResults, to store the identified path and execution-time
profiling results. Analyze the results in the Code Profile
Analyzer.coder.profile.show(analysisResults);
On the Flame Graph panel, expand the Task to
analyze drop-down list. The drop-down list contains only one task,
CriticalPathIdentify_step[1 0], because the model is single rate. The
task name in the drop-down list contains period and offset values of the task [1
0]. Select CriticalPathIdentify_step[1 0] and click
Display.
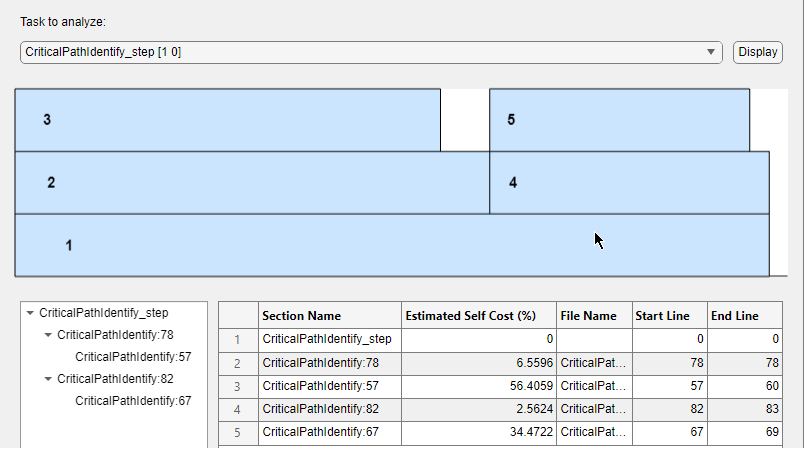
The panel displays a flame graph. Below the graph, code sections in the critical path
for the task CriticalPathIdentify_step are shown in the table following
the execution order. The table columns provides this information:
Section Name — Name of code sections in the identified critical path. The section names are in
modelName:Start Lineformat.Estimated Self Cost — Percentage of the task execution time spent for the corresponding section. For example, if the longest execution time of a task is 100 ns and the Estimated Self Cost of one section of the critical path is
20%, then the section takes 20 ns for execution. Note that if a section transfers execution control to another section, the Estimated Self Cost does not include the time spent executing the transferred section.File Name — Filename that contains section code.
Start Line — Line number of the section start code.
End Line — Line number of the section end code.
The first row of the table contains the task name as the entrypoint. The most
expensive code section is CriticalPathIdentify:57, which runs from code
lines 57 to 60.
The flame graph shows a visual representation of task execution hierarchy and flow.
The graph contains rectangles for code sections in the critical path to represent the
execution flow. For example, rectangle 1 visualizes execution of the
task CriticalPathIdentify_step. The task first executes section
2, which transfers the execution to section 3.
Once the execution of section 3 is complete, the execution control
comes back to section 2 and the section 1. Next,
the execution moves to section 4, which transfers the execution to
section 5. The width of the rectangles represents the time spent for
the corresponding sections. In the flame graph, the rectangles of the top-level sections
include the execution times of their lower-level sections. For example, rectangle
2 represents the time spent executing the section
2 and 3. However, the Estimated Self
Cost for section 2
CriticalPathIdentify:78 in the table does not include the time spent
executing the transferred section.
To view code lines of a code section in the generated code:
In the table, click the section table row. For example, click
CriticalPathIdentify:78On the toolstrip, in the Results section, click Highlight Code.

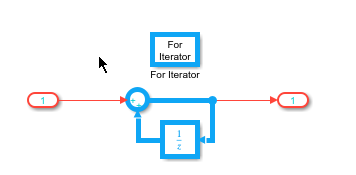
Code line 78 calls the ForIterator1 function,
which passes execution control to the most expensive section,
CriticalPathIdentify:57.
To highlight the critical path in the model canvas, on the toolstrip, in the
Results section, click Highlight Path.
Alternative, you can use coder.profile.test.getCriticalPathElements and coder.profile.test.hiliteCriticalPath functions.
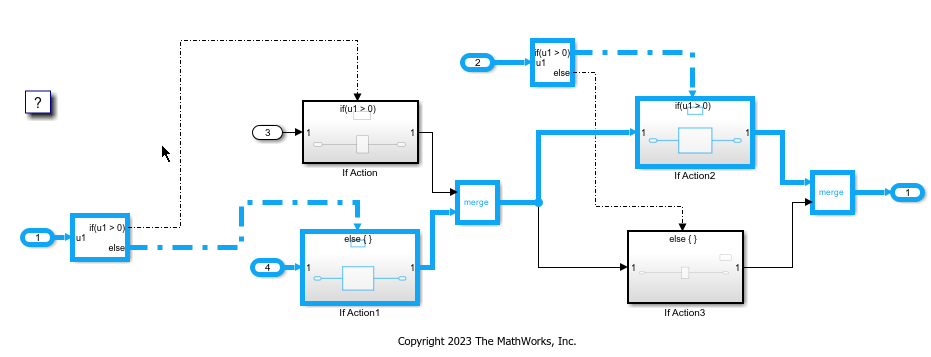
Clicking Highlight Path also highlights the part of the critical path in subsystems.
Using bidirectional model-to-code traceability, you can see that the most expensive
section CriticalPathIdentify:57 is executed when the logical expression
of the If block is false.
To optimize the execution speed of the critical path, remodel or use available optimization techniques targeting the most expensive section. For more information about available optimization techniques, see Execution Speed.
If you have a Simulink
Design Verifier license, use the coder.profile.test.generateCriticalPathTest function to generate a new set
of test cases that exercise the identified path.
newTestFile = coder.profile.test.generateCriticalPathTest(analysisResults);
Data file:
 /users/sldv_output/CriticalPathIdentify/CriticalPathIdentify_sldvdata.mat

newTestFile =

 '/users/sldv_output/CriticalPathIdentify/CriticalPathIdentify_test.mldatx'
If you have a Simulink
Test license, you can use the test file
CriticalPathIdentify_test.mldatx to automate profiling by using
coder.profile.test.runTests to produce longest execution times for the task
and identify the most demanding tests. For more information, see Identify Hotspots in
Generated Code.
Limitations
The estimated self cost of sections in critical paths can be impacted by your target characteristics and SIL/PIL environment.