Stack Usage Profiling for Code Generated From MATLAB Code
To determine the size of stack memory that is required to run generated code, you can run a software-in-the-loop (SIL) or processor-in-the-loop (PIL) execution that generates a stack usage profile. The SIL or PIL execution instruments the generated code and uses the instrumentation to calculate stack usage. When the execution is complete, you can view a code stack profiling report that shows minimum, average, and maximum memory demand. Using the Simulation Data Inspector, you can observe streamed stack usage information during and after the execution. The profiles that you generate enable you to observe the effect of compiler optimization and data input on stack usage.
Benefits of Dynamic Stack Usage Profiling
Static stack usage analysis has some limitations. For example, it does not consider:
Memory optimization performed by a compiler. For example, variables that are optimized away or stored in registers.
Additional memory that the compiler uses in a function call. Compilers store the address to which the execution returns after the function call.
Memory alignment that the compiler applies.
The dynamic stack usage profiling provided by a SIL or PIL execution does not have the listed limitations because the execution calculates the actual memory usage of the compiled code.
Generate Stack Usage Profile
Before running a software-in-the-loop or processor-in-the-loop (PIL) execution, enable stack usage profiling:
To open the MATLAB® Coder™ app, on the MATLAB Toolstrip Apps tab, under Code Generation, click the app icon. The app opens the Create MATLAB Coder Project dialog box.
To open your project, click Open, navigate to the folder that contains your MATLAB Coder project file, and select the file. For example,
kalman_filter01.coderprj.Click Settings > View all settings. Select the Enable entry point stack profiling check box.
Note
Stack usage profiling does not support the OpenMP library. Before you generate code, clear the Enable OpenMP library if possible checkbox.
Or, from the Command Window, specify properties of your
coder.EmbeddedCodeConfig object. For
example:
% Enable entry point stack usage profiling
config.CodeStackProfiling = true;

% Disable OpenMP
config.EnableOpenMP = false;
View Stack Usage Profile From SIL Execution
For a MATLAB function, perform a software-in-the-loop execution that generates stack usage measurements and then use the data to determine stack memory requirements.
In your local working folder, create the function foo.m, which
evaluates an integer factorial by using a recursive
function.
function out = foo(in)
  coder.inline('never');
  out = factorial_(in);
end

function out = factorial_(in)
  coder.inline('never');
  if in == 1
      out = 1;
  else
      out = in * factorial_(in-1);
  end
end
Configure stack usage profiling for the SIL execution.
config = coder.config('lib');
config.GenerateReport = true;
config.VerificationMode = 'SIL';
config.CodeStackProfiling = true;
config.EnableOpenMP = false;
In the folder, create test_example.m, a MATLAB script that calls the compiled function multiple
times.
for idx = 1: size(X,1)
    Y(idx,1) = foo(X(idx,1));
end
Create a test vector of integers.
X=[1 2 5 8]';
Generate library code for the foo
MATLAB function and the SIL interface and start the SIL
execution.
codegen -report -config config foo -args {1} -test test_example
Code generation successful: View report

Running test file: 'test_example' with MEX function 'foo_sil.mexw64'.
### Starting SIL execution for 'foo'
    To terminate execution: clear foo_sil
    Stack profiling data is available for viewing. Open Simulation Data Inspector.
    Stack profiling report available after termination.
To observe streamed stack usage measurements while the execution runs, click the
Simulation Data Inspector
link.
To open the code stack profiling report, terminate the SIL execution process by
clicking the link clear
foo_sil.
### Application stopped
### Stopping SIL execution for 'foo'
    Stack profiling report: report(getCoderStackProfile('foo'))
Then, click the link report(getCoderStackProfile('foo')).
You can create a workspace variable that holds the execution time data.
stackUsageProfile= getCoderStackProfile('foo');If you close the report, you can reopen the report by running:
report(stackUsageProfile)

Section 1:
Provides information that indicates how the target compiler views memory and aligns variables.
States whether a target-specific or generic driver obtained stack usage data from the target hardware.
Provides a timestamp for the report.
Section 2 provides, for each task, this information:
Minimum, average, and maximum stack usage in bytes.
Number of times the generated code is called.
The report provides more information through clickable icons. The workspace
variable, for example, stackUsageProfile, must be present in the
base workspace.
If you click ![]() , you can view the stack usage distribution for
the execution.
, you can view the stack usage distribution for
the execution.

If you click ![]() , you can view the variation of stack usage over
the execution.
, you can view the variation of stack usage over
the execution.
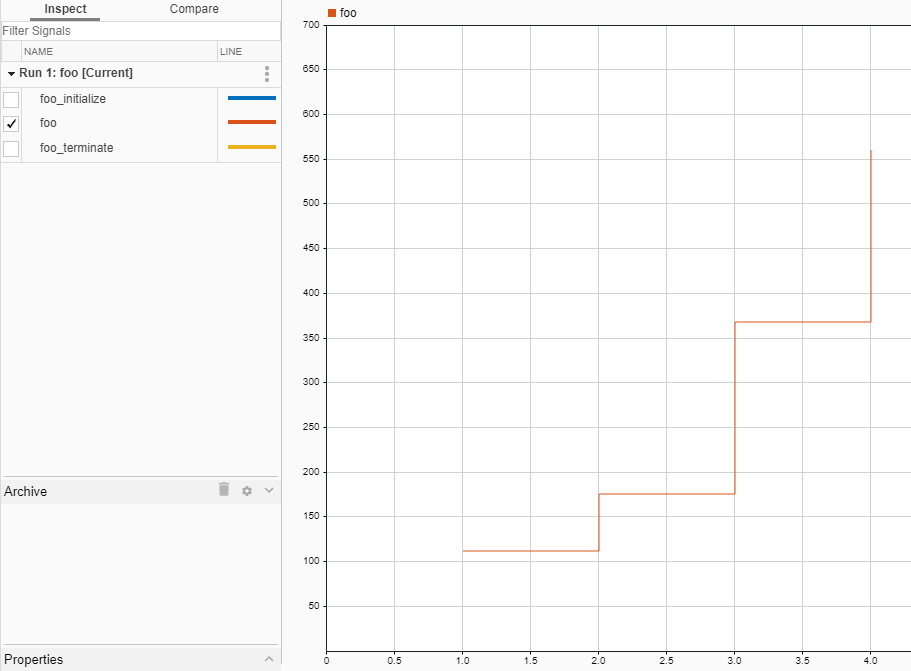
The integer value of the input argument for foo increases with
successive calls to the function. As the integer value increases, the number of
recursive calls to the function factorial_() also increases,
which results in the observed increases of stack memory usage.
Section 3 displays the maximum stack use for each task with reference to the
maximum stack size permitted. In the SIL or PIL execution, the MATLAB
Coder configuration setting StackUsageMax parameter
specifies the maximum stack size, which the bar chart displays as a horizontal red
line. If the StackUsageMax value is much greater than the stack
usage of the tasks, the bar chart does not display a red line. To help your visual
analysis of stack usage requirements, you can use the
MaxStackUsageAllowed property of the workspace variable to
respecify the maximum stack size value. For example:
stackUsageProfile= getCoderStackProfile('foo');
stackUsageProfile.MaxStackUsageAllowed = 550;
report(stackUsageProfile);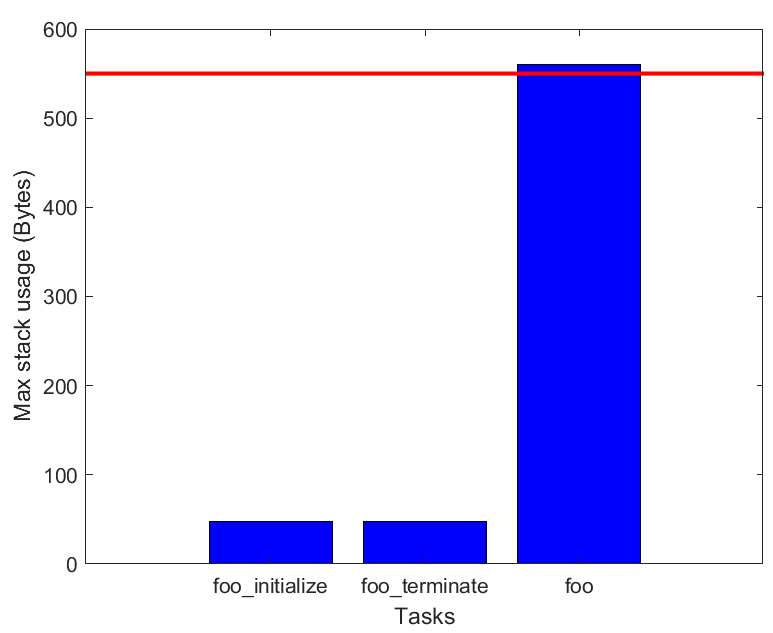
Automate Stack Usage Analysis of Code Generated from MATLAB Functions
You can use the coder.profile.test.runTests function to run software-in-the-loop
(SIL) or processor-in-the-loop (PIL) tests of a MATLAB function and produce stack usage metrics for the generated code. To
view and analyze the metrics, use the Code Profile Analyzer app.
For more information, see Automate Execution-Time and Stack Usage Profiling of MATLAB Function.
Implement Driver to Obtain Stack Usage Data During PIL Execution
A PIL execution requires a driver implementation that obtains stack usage data from the target hardware. The driver must return the value of the stack register.
Note
If you do not specify a driver for your target hardware, the PIL execution tries to use a default generic driver.
When you set up PIL target connectivity, specify the driver through an rtw.connectivity.Config
classdef overheadConnectivityConfig < rtw.connectivity.Config
  methods
    function this = customConnectivityConfig(componentArgs)

      % Create builder
      targetApplicationFramework = ...
        mypil.TargetApplicationFramework(componentArgs);
      builder = rtw.connectivity.MakefileBuilder(componentArgs, ...
        targetApplicationFramework, '');

      % Create launcher
      launcher = mypil.Launcher(componentArgs, builder);

      % Set up communication
      hostCommunicator = rtw.connectivity.RtIOStreamHostCommunicator(...
                         componentArgs, ...
                         launcher, ...
                         rtiostreamLibTCPIP);

      % Call super class constructor to register components
        this@rtw.connectivity.Config(componentArgs,...
                                     builder,...
                                     launcher,...
                                     hostCommunicator);

      % Specify driver implementation that obtains stack usage
      % data from the target hardware
      stackUsageDriver = coder.profile.StackDriver();

      stackUsageDriver.PtrDataType = 'uint64';
      stackUsageDriver.HeaderFile = 'myHeaderFile.h';
      stackUsageDriver.SourceFile = 'mySourceFile.c';
      stackUsageDriver.IncludePaths = {'path/To/myFolder1', ...
                                       'path/To/myFolder2', ...
                                       'path/To/myFolder3'};
      stackUsageDriver.DriverFunction = 'myDriverFunction';
      this.setStackDriver(stackUsageDriver);
    end
  end
end
For more information about setting up PIL target connectivity, see:
See Also
coder.profile.StackDriver | coder.profile.test.runTests