Create and Modify Markov Chain Model Objects
A state transition matrix P characterizes a discrete-time,
time-homogeneous Markov chain. For details on supported forms of P,
see Discrete-Time Markov Chain Object Framework Overview. If you have a
theoretical or empirical state transition matrix, create a Markov chain model object by
using dtmc.
Otherwise, you can create a Markov chain from a randomly generated transition matrix of
a specified structure, such as the number of infeasible transitions, by using mcmix.
Create Markov Chain from Stochastic Transition Matrix
This example shows how to create a Markov chain object to model a hypothetical economic cycle using a stochastic transition matrix.
Suppose that the dynamic behavior of the real US gross domestic product (GDP) switches between four models:
Regime 1: An autoregressive model with a low mean and low volatility
Regime 2: An autoregressive model with a low mean and high volatility
Regime 3: An autoregressive model with a high mean and low volatility
Regime 4: An autoregressive model with a high mean and high volatility
Consider this right-stochastic transition matrix containing the probabilities of state transitions between time steps t and t + 1, for all t.
For example, means the probability that real GDP transitions from Regime 2 to Regime 3 in the next time step is 0.5.
Set the transition matrix to a variable.
P = [0.5 0.5 0.0 0.0;
     0.5 0.0 0.5 0.0;
     0.0 0.0 0.0 1.0;
     0.0 0.0 1.0 0.0];
Create a Markov chain object characterized by the transition matrix P.
mc = dtmc(P)
mc =
  dtmc with properties:

             P: [4×4 double]
    StateNames: ["1"    "2"    "3"    "4"]
     NumStates: 4
mc is a dtmc object. MATLAB® displays properties and corresponding values of mc at the command line.
The association of names to the states enhances displays of function output and plots of the chain. When you create the Markov chain object, you can associate names to the states by using the 'StateNames' name-value pair argument. After you create the object, you can associate names to the states by setting the StateNames property using dot notation.
Associate names to the states in mc by using dot notation. Elements of the string vector containing the names correspond to the rows and columns of P.
stateNames = ["Regime 1" "Regime 2" "Regime 3" "Regime 4"];
mc.StateNames = stateNames;
Plot a digraph of the Markov chain.
figure;
graphplot(mc);
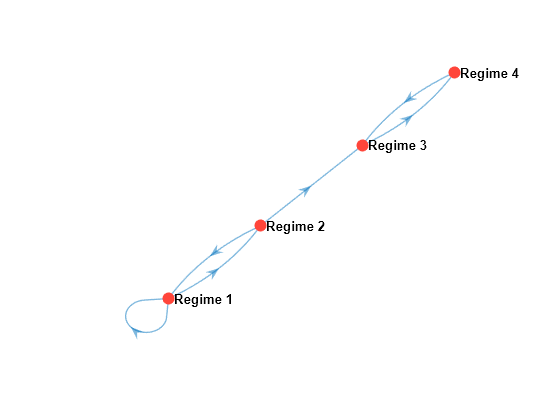
After creating and plotting the Markov chain, you can determine characteristics of the chain, such as its stationary distribution by using asymptotics or its state distribution evolution by using redistribution.
Create Markov Chain from Random Transition Matrix
This example shows how to create a Markov chain object from a right-stochastic transition matrix that is randomly generated. Such a Markov chain is convenient for exploration and testing.
Create a random Markov chain object containing five arbitrary states.
rng(1); % For reproducibility
numStates = 5;
mc = mcmix(numStates)
mc =
dtmc with properties:
P: [5×5 double]
StateNames: ["1" "2" "3" "4" "5"]
NumStates: 5
mc is a dtmc object.
Display the transition matrix and verify that the sum of every row is 1.
mc.P
ans = 5×5

    0.3259    0.0358    0.1149    0.3602    0.1632
    0.0298    0.1478    0.2409    0.2626    0.3189
    0.0162    0.3982    0.3469    0.1166    0.1221
    0.0944    0.2965    0.0102    0.4389    0.1600
    0.3439    0.2710    0.2938    0.0404    0.0509
sum(mc.P,2)
ans = 5×1

    1.0000
    1.0000
    1.0000
    1.0000
    1.0000
Plot a digraph of the Markov chain. Indicate probabilities of transition by using edge colors.
figure;
graphplot(mc,'ColorEdges',true);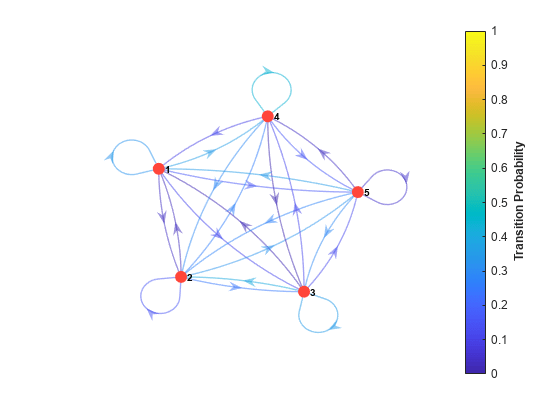
Specify Structure for Random Markov Chain
This example shows how to specify certain infeasible transitions and randomly distribute others within a transition matrix for a Markov chain.
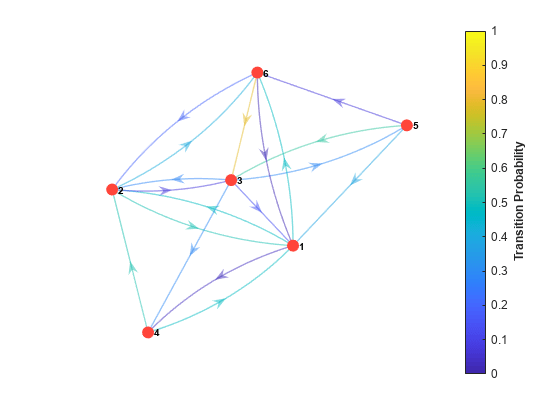
Create a six-state Markov chain from a random transition matrix. Plot its digraph and indicate transition probabilities by using edge colors.
rng(1); % For reproducibility
numStates = 6;
mc1 = mcmix(numStates);

figure;
graphplot(mc1,'ColorEdges',true)
mcmix produces a Markov chain such that all states are persistent and all states are reachable from any other state.
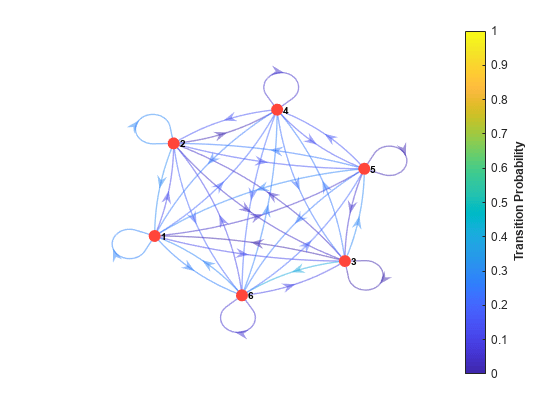
Create another six-state Markov chain, but without any persistent states and with 12 other infeasible transitions in random locations in the transition matrix.
Fix = ones(numStates) - eye(numStates);
Fix(Fix == 1) = NaN;
zeros = 12;
mc2 = mcmix(numStates,'Zeros',zeros,'Fix',Fix);
Display the transition matrix of mc2. Plot a digraph of mc2 and indicate transition probabilities by using edge colors.
mc2.P
ans = 6×6

         0    0.4845         0    0.0344         0    0.4811
    0.5107         0    0.0791         0         0    0.4102
    0.1397    0.2701         0    0.2954    0.2948         0
    0.4767    0.5233         0         0         0         0
    0.3710         0    0.5550         0         0    0.0740
    0.0179    0.1947    0.7874         0         0         0
figure;
graphplot(mc2,'ColorEdges',true)