Import Time Series Data into Econometric Modeler App
These examples show how to import time series data into the Econometric Modeler app. Before you import the data, you must prepare the data at the MATLAB® command line (see Prepare Time Series Data for Econometric Modeler App).
Import Data from MATLAB Workspace
This example shows how to import data from the MATLAB Workspace into Econometric Modeler. The data set Data_Airline.mat contains monthly counts of airline passengers.
Download the Data_Airline.mat MAT-file into your current folder, and
then load it into the workspace.
fldr = pwd;
openExample("Data_Airline.mat",workDir=fldr);
load(fullfile(fldr,"Data_Airline.mat"))
To change the folder to which to download the data set, set fldr to its
absolute path.
At the command line, open the Econometric Modeler app.
econometricModeler
Alternatively, open the app from the apps gallery (see Econometric Modeler).
Import the MATLAB timetable containing the data:
On the Modeler tab, in the Import section, click
 .
.In the Import Data dialog box, select the check box for the
DataTimeTablevariable.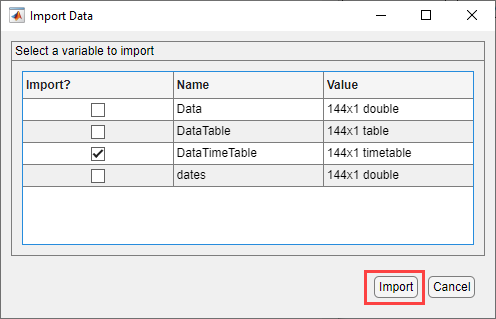
Click Import.
The variable PSSG appears in the Time
Series pane, and its time series plot appears in the
Plot(PSSG) figure window.
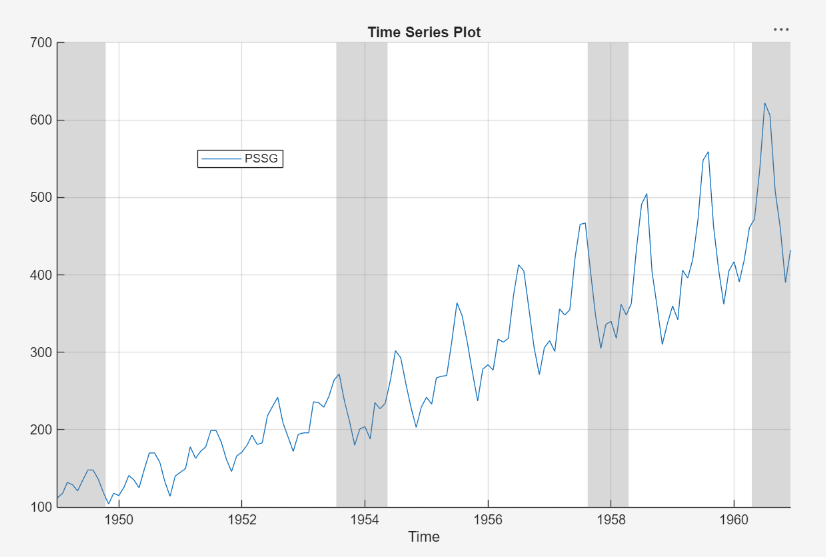
The series exhibits a seasonal trend and serial correlation, but an exponential growth is not apparent. For an interactive analysis of serial correlation, see Detect Serial Correlation Using Econometric Modeler App.
Import Data from MAT-File
This example shows how to import data from a MAT-file, stored
on your machine, into Econometric Modeler. Suppose that the data set is named
Data_Airline.mat and is stored in the
MyData folder of your C drive.
At the command line, open the Econometric Modeler app.
econometricModeler
Alternatively, open the app from the apps gallery (see Econometric Modeler).
Import the MAT-file containing the data:
On the Modeler tab, in the Import section, click Import > Import From MAT-file.
In the Select a MAT-file window, browse to the
C:\MyDatafolder. Select Data_Airline.mat, then click Open.
In the Import Data dialog box, select the check box for the
DataTimeTablevariable.Click Import.
The variable PSSG appears in the Time
Series pane, and its time series plot appears in the
Plot(PSSG) figure window.