Create and Evaluate Fault Trees Programmatically
R2026bIn this example, you programmatically create and evaluate a fault tree in the Safety Analysis Manager. You create a fault tree, define its gates and events, and evaluate the tree. You then repeat the evaluation by sweeping the event probability, and plot the top-level gate failure probability against the swept event probability.
For information about interactively creating and evaluating fault trees by using the Safety Analysis Manager, see:
Create Fault Tree Document and Tree Structure
Create a new fault tree document by using the safetyAnalysisMgr.newDocument function. New fault tree documents contain
one fault tree with a single OR top-level gate. Access the fault tree and its gate from
the FaultTreeDocument object.
myTreeDoc = safetyAnalysisMgr.newDocument("fault-tree");
myFaultTree = myTreeDoc.FaultTrees(1);
topGate = myFaultTree.Gates(1);
You can add gates or events to another gate in the fault tree document. In this
example, create an AND gate as an input to the top-level gate by using the createGate function. Then, create three basic events by using the
createEvent function. Assign one event to the top-level gate and two
events to the AND gate.
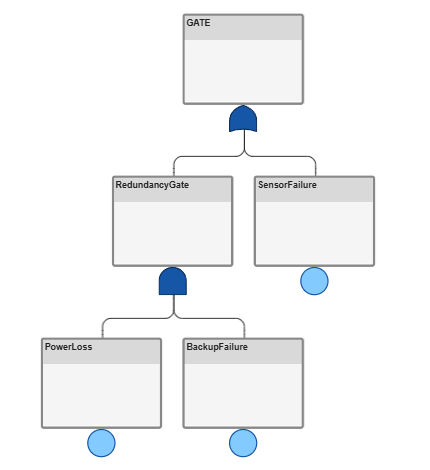
andGate = createGate(topGate,Type="and",Label="RedundancyGate");
sensorFailure = createEvent(topGate,Label="SensorFailure");
powerLoss = createEvent(andGate,Label="PowerLoss");
backupFailure = createEvent(andGate,Label="BackupFailure");
The events represent a sensor, a power system, and a backup power system. In this example, the top-level failure occurs if the sensor fails or both the power and backup systems fail simultaneously. Open the Safety Analysis Manager to view the structure.
safetyAnalysisManager
Define Failure Probabilities
By default, basic events use the constant failure model. The constant failure model
assumes that the unavailability and failure frequency of the event do not change with
time. Events can use the constant, rate, time at risk, mean time to failure (MTTF),
dormant, or logical failure model types. See Define Event Properties. In this
example, set the Q and W values for each
event.
sensorFailure.FailureModel.Parameters.Q.Value = 0.01;
sensorFailure.FailureModel.Parameters.W.Value = 0.001;

powerLoss.FailureModel.Parameters.Q.Value = 0.05;
powerLoss.FailureModel.Parameters.W.Value = 0.005;

backupFailure.FailureModel.Parameters.Q.Value = 0.03;
backupFailure.FailureModel.Parameters.W.Value = 0.003;
Evaluate the Fault Tree Document
By default, fault trees evaluate using exact computation. For larger fault tree
documents, the rare-event approximation can improve evaluation speed. You can configure
the evaluation by setting the analysis type of the EvalConfig object.
In this example, evaluate the fault tree document by using the evaluate function.
evaluate(myTreeDoc)
After the evaluation, access the failure probability of the top-level gate from the
FailureProperties object. For more information on evaluating fault trees,
see Evaluate Fault Tree Documents.
topGateQ = topGate.FailureProperties.Q
topGateQ =

    0.0115
Sweep Event Probability and Collect Results
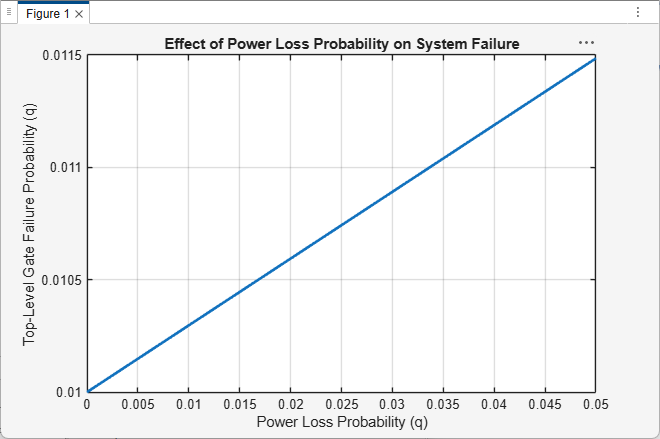
To investigate how the powerLoss event failure probability
affects the top-level gate failure probability, sweep
the q value for the powerLoss event from
0 to 0.05. For each value, update the failure
model parameter, re-evaluate the fault tree, and store the top-level gate failure
probability.
qSweep = linspace(0,0.05,20);
topGateResults = zeros(size(qSweep));

for i = 1:length(qSweep)
    powerLoss.FailureModel.Parameters.Q.Value = qSweep(i);
    evaluate(myTreeDoc);
    topGateResults(i) = topGate.FailureProperties.Q;
end
Plot Results
Plot the top-level gate failure probability against the swept
powerLoss event probability.
figure
plot(qSweep,topGateResults,LineWidth=2)
xlabel("Power Loss Probability (q)")
ylabel("Top-Level Gate Failure Probability (q)")
title("Effect of Power Loss Probability on System Failure")
grid on