Evaluate Fault Tree Documents
R2026bIn fault tree documents, you calculate metrics about failures by evaluating the fault tree. This evaluation determines if the base-level events are likely to induce the failure at the top-level gate of the tree, the combination of events that must occur to generate the failure at the top-level gate, and the event importance. For more information on creating events and gates, see Create Fault Tree Events and Create Fault Tree Gates.
To evaluate a fault tree document, you can select the fault trees and properties that you want to include in your evaluation. When you evaluate the fault tree document, the Safety Analysis Manager calculates these metrics at the selected fault trees:
Failure probability or unavailability (
q) at gates and events.Failure frequency (
w) at gates and events.Cutsets of the fault trees. Cutsets are the viable paths of events and gates that could activate a specified gate.
Importance measures of events. Importance measures represent how important an event is to a cutset or the activation of a gate.
After running the evaluation, you can investigate the results in the fault tree or by using the Artifacts pane.
Prepare Fault Tree Document for Evaluation
Before evaluating the fault tree document, configure the evaluation properties. In the Tree section, click Evaluate > Configure Evaluation. The Evaluation Configuration window opens.
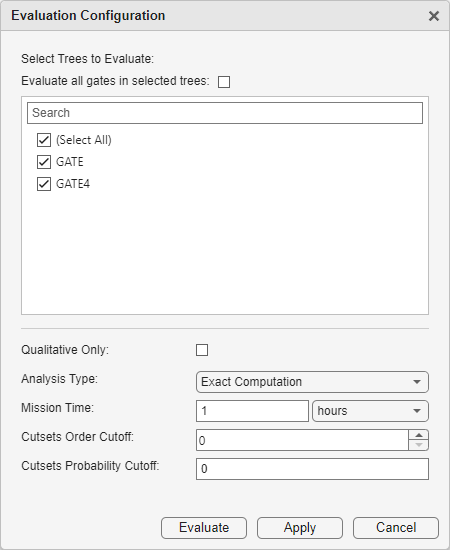
By default, the evaluation includes all the fault trees in the fault tree document. If you omit a fault tree, the evaluation does not calculate the values for q and w, the cutsets, or the importance measures of the fault tree. However, if one of the selected trees includes an omitted tree as an input from a transfer gate, the evaluation calculates and stores the omitted tree metrics.
By default, when you evaluate a fault tree document, the Safety Analysis Manager only calculates and stores the q and w values for the events and top-level gate. To calculate and display these values at other gates, follow one of these approaches:
Enable the Compute Properties property for each gate. Select the gate and, in the Properties pane, select Compute Properties.
In the Evaluation Configuration window, select the Evaluate all gates in selected trees property. When you select this property, the evaluation ignores the settings of the Compute Properties property in all the gates in the document.
You can determine the additional scope of the analysis by setting these properties:
Qualitative Only — Select this check box to only calculate the cutsets for the selected trees.
Analysis Type — Specifies the algorithm that the Safety Analysis Manager uses to evaluate the fault tree. You can select from these options:
Exact Computation— The Safety Analysis Manager calculates the unavailability and failure frequencies for each gate and cutset without approximation.Rare Event Approximation— The Safety Analysis Manager calculates the unavailability and failure frequencies for each gate and cutset by using the rare-event approximation. To calculate these values, the Safety Analysis Manager uses the values associated with cutsets. For more information on this algorithm, see [1].
Mission Time — The length of time to apply to the evaluation. The default unit is hours. Rate and MTTF failure models use this setting. Time at risk models also use a time value, but their time value is not affected by this property. For more information, see Define Event Properties. You cannot set this property if you select the Qualitative Only property.
Cutsets Order Cutoff — The cutset order cutoff. The cutset order of a cutset represents the number of events that contribute to the cutset. The evaluation excludes cutsets with a higher order than this value. If this property is
0, the Safety Analysis Manager does not exclude cutsets based on their order. If you exclude cutsets and you set Analysis Type to Rare Event Approximation, the values for q and w can change.Cutsets Probability Cutoff — The cutset probability cutoff. If the cutset
qvalue is larger than this value, the Safety Analysis Manager does not store the cutset. You cannot set this property if you select the Qualitative Only property.
Run Evaluation and View Results
To evaluate the fault tree document, in the Tree section, click Evaluate. Large fault trees can be computationally expensive. To terminate the evaluation, click Stop.
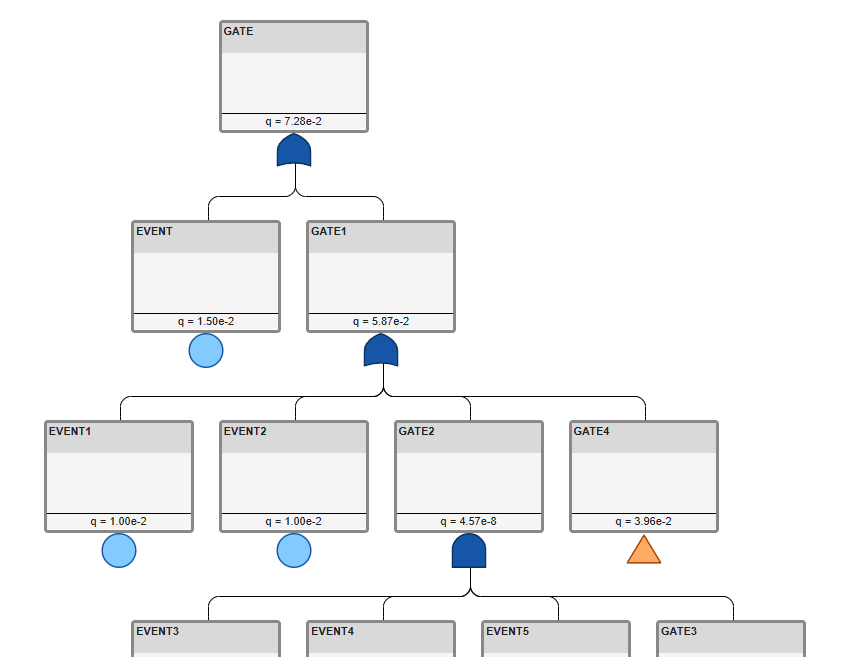
When the evaluation completes, the events, top-level gates, and gates with
Compute Properties enabled display the calculated
q values. Events with logical type failure models display the
failure status.
Note
Gates that introduce negation, such as NOT and XOR gates, do not support frequency calculations when Analysis Type is
Exact Computation. If you evaluate a tree that contains these gates, the upstream gates generate erroneous failure frequencies.Transfer gates that do not have an assigned gate evaluate with a failure unavailability and frequency of
0.
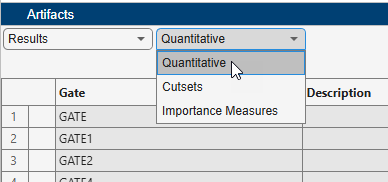
You can also view the results in the Artifacts pane. Click
Artifacts at the bottom of the Safety Analysis
Manager, then set the drop-down list in the top-left corner of the pane to
Results. An additional drop-down list appears. Use this
list to view the quantitative results, cutsets, and importance measures for the fault
tree document.
To filter the results, enter a term in the Search box. You can use the drop-down list to filter the results based on the specified property.
By default, the pane lists the results for each gate in the order that the gate was created. To sort the results alphabetically and by numerical size, point to the right side of one of the columns and click. You can sort in ascending or descending order for the column that you select.
Quantitative Results
If you set the drop-down list to Quantitative, the
Artifacts pane displays the q,
w, and the conditional failure intensity
(cfi) values for each gate in the fault tree document in the
q, w, and cfi
columns. The cfi is the ratio of the failure frequency over 1-q at the gate:
The table only lists gates for which you calculate and store the q and w values. If you select Qualitative Only in the Evaluation Configuration window, the table is empty.
Cutsets
If you set the drop-down list to Cutsets, the
Artifacts pane displays the cutsets in the selected fault
tree in the fault tree document. You can select the gate from the
Gate list.
To highlight the cutset, select the cutset and click the Trace cutset button . If the event must occur to contribute to the cutset, the event and the path are red. If the event must not occur for the failure to occur, such as with a NOT gate, the event and the path are blue.
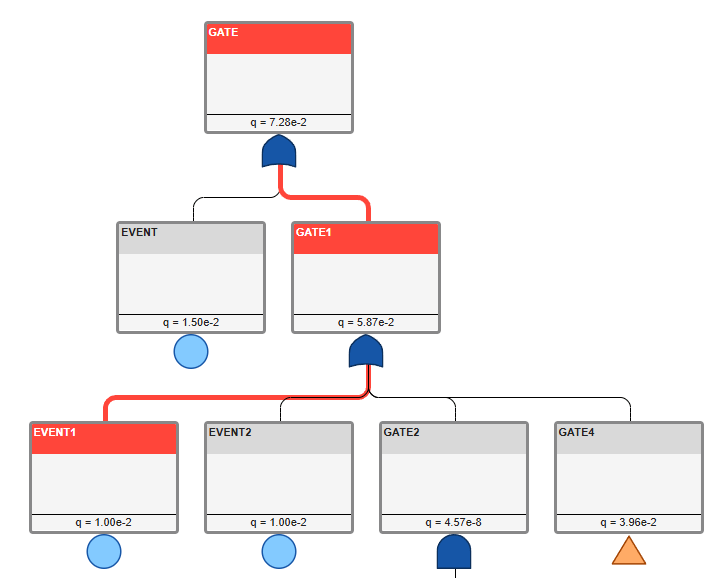
Events that use a logical failure model are always highlighted.
If you include the quantitative results, the q and w columns list the unavailability and failure frequency of the cutset. You can only select gates for which you calculate and store the q and w values.
Importance Measures
If you set the drop-down list to Importance Measures, the
Artifacts pane displays the importance measures for the
input events to each gate. You can select the gate from the
Gate list. For each gate, each event includes these
importance measures:
| Importance Measure | Description | Equation |
|---|---|---|
| Birnbaum | How sensitive the failure probability at the gate is due to the failure probability changes of the event. |
|
| Fussell-Vesely | The likelihood that the event contributes to the cutsets of the gate. |
|
| Criticality | How significant the event is to the likelihood of the failure at the gate. |
|
The equations use these variables and operations:
G — The gate.
E — The event.
P(E) — The failure probability calculated at E.
P(G) — The failure probability calculated at G.
P(G|E) — The conditional probability that G occurs if E occurs.
P(G|Ē) — The conditional probability that G occurs if E does not occur.
For more information on how to calculate these measures, see [2].
Note
The importance measures of the events are invalid if the fault tree includes gates that introduce negation, such as NOT and XOR gates.
This table is empty unless you select Evaluate all gates in selected trees in the Evaluation Configuration window, or you clear the Compute Properties property of a gate.
References
[1] Vesely, W.E., F.F. Goldberg, N.H. Roberts, and D.F. Haasl. Fault Tree Handbook. U.S. Nuclear Regulatory Commission, 1981.
[2] Rauzy, Antoine. Probabilistic Safety Analysis with XFTA. The AltaRica Association, 2020.
See Also
Topics
- Create Fault Tree Events
- Create Fault Tree Gates
- Organize Fault Trees in Fault Tree Documents
- Copy Fault Tree Artifacts
- Link Safety Analysis Manager Fault Tree Artifacts to Requirements, Tests, and Faults
- Export Fault Trees to PDFs
- Create and Evaluate Fault Trees Programmatically
- Modularize Fault Tree Documents

