Creating an IRDataCurve Object
To create an IRDataCurve object, see the
following options:
Use IRDataCurve with Dates and Data
This example shows how to use IRDataCurve with vectors of dates and data to create an interest-rate curve object.
When constructing the IRDataCurve object, you can also use optional inputs to define how the interest-rate curve is constructed from the dates and data.
Create the vectors for Dates and Data for an interest-rate curve.
Data = [2.09 2.47 2.71 3.12 3.43 3.85 4.57 4.58]/100;
Dates = daysadd(today,[360 2*360 3*360 5*360 7*360 10*360 20*360 30*360],1);
Use IRDataCurve to build interest-rate objects based on the constant and pchip interpolation methods.
irdc_const = IRDataCurve('Forward',today,Dates,Data,'InterpMethod','constant');
irdc_pchip = IRDataCurve('Forward',today,Dates,Data,'InterpMethod','pchip');
Plot the forward and zero rate curves for the two IRDataCurve objects based on constant and pchip interpolation methods.
PlottingDates = daysadd(today,180:10:360*30,2);
plot(PlottingDates, getForwardRates(irdc_const, PlottingDates),'b')
hold on
plot(PlottingDates, getForwardRates(irdc_pchip, PlottingDates),'r')
plot(PlottingDates, getZeroRates(irdc_const, PlottingDates),'g')
plot(PlottingDates, getZeroRates(irdc_pchip, PlottingDates),'yellow')
legend({'Constant Forward Rates','PCHIP Forward Rates','Constant Zero Rates', ...
'PCHIP Zero Rates'},'location','SouthEast')
title('Interpolation Methods for IRDataCurve Objects')
datetick

The plot demonstrates the relationship of the forward and zero rate curves.
Bootstrap IRDataCurve Based on Market Instruments
Use the bootstrapping function, based on market instruments, to create an
interest-rate curve object. When bootstrapping, you also have the option to define a
range of interpolation methods (linear,
spline, constant, and
pchip).
Bootstrap Swap Curve from Deposits, Eurodollar Futures, and Swaps
This example shows how to bootstrap a swap curve from deposits, Eurodollar Futures, and swaps. The input market data for this example is hard-coded and specified as two cell arrays of data; one cell array indicates the type of instrument and the other contains the Settle, Maturity values, and a market quote for the instrument. For deposits and swaps, the quote is a rate; for the EuroDollar futures, the quote is a price. Although bonds are not used in this example, a bond would also be quoted with a price.
InstrumentTypes = {'Deposit';'Deposit';'Deposit';'Deposit';'Deposit'; ...
    'Futures';'Futures'; ...
    'Futures';'Futures';'Futures'; ...
    'Futures';'Futures';'Futures'; ...
    'Futures';'Futures';'Futures'; ...
    'Futures';'Futures';'Futures'; ...
    'Futures';'Futures';'Futures'; ...
    'Swap';'Swap';'Swap';'Swap';'Swap';'Swap';'Swap'};

Instruments = [datenum('08/10/2007'),datenum('08/17/2007'),.0532063; ...
    datenum('08/10/2007'),datenum('08/24/2007'),.0532000; ...
    datenum('08/10/2007'),datenum('09/17/2007'),.0532000; ...
    datenum('08/10/2007'),datenum('10/17/2007'),.0534000; ...
    datenum('08/10/2007'),datenum('11/17/2007'),.0535866; ...
    datenum('08/08/2007'),datenum('19-Dec-2007'),9485; ...
    datenum('08/08/2007'),datenum('19-Mar-2008'),9502; ...
    datenum('08/08/2007'),datenum('18-Jun-2008'),9509.5; ...
    datenum('08/08/2007'),datenum('17-Sep-2008'),9509; ...
    datenum('08/08/2007'),datenum('17-Dec-2008'),9505.5; ...
    datenum('08/08/2007'),datenum('18-Mar-2009'),9501; ...
    datenum('08/08/2007'),datenum('17-Jun-2009'),9494.5; ...
    datenum('08/08/2007'),datenum('16-Sep-2009'),9489; ...
    datenum('08/08/2007'),datenum('16-Dec-2009'),9481.5; ...
    datenum('08/08/2007'),datenum('17-Mar-2010'),9478; ...
    datenum('08/08/2007'),datenum('16-Jun-2010'),9474; ...
    datenum('08/08/2007'),datenum('15-Sep-2010'),9469.5; ...
    datenum('08/08/2007'),datenum('15-Dec-2010'),9464.5; ...
    datenum('08/08/2007'),datenum('16-Mar-2011'),9462.5; ...
    datenum('08/08/2007'),datenum('15-Jun-2011'),9456.5; ...
    datenum('08/08/2007'),datenum('21-Sep-2011'),9454; ...
    datenum('08/08/2007'),datenum('21-Dec-2011'),9449.5; ...
    datenum('08/08/2007'),datenum('08/08/2014'),.0530; ...
    datenum('08/08/2007'),datenum('08/08/2017'),.0545; ...
    datenum('08/08/2007'),datenum('08/08/2019'),.0551; ...
    datenum('08/08/2007'),datenum('08/08/2022'),.0559; ...
    datenum('08/08/2007'),datenum('08/08/2027'),.0565; ...
    datenum('08/08/2007'),datenum('08/08/2032'),.0566; ...
    datenum('08/08/2007'),datenum('08/08/2037'),.0566];
bootstrap is called as a function of the IRDataCurve object. Inputs to this function include the curve Type (zero or forward), Settle date, InstrumentTypes, and Instrument data. The bootstrap function also supports optional arguments, including an interpolation method, compounding, basis, and an options structure for bootstrapping. For example, you are passing in an IRBootstrapOptions object which includes information for the ConvexityAdjustment to forward rates.
IRsigma = .01;
CurveSettle = datenum('08/10/2007');
bootModel = IRDataCurve.bootstrap('Forward', CurveSettle, ...
InstrumentTypes, Instruments,'InterpMethod','pchip', ...
'Compounding',-1,'IRBootstrapOptions',...
IRBootstrapOptions('ConvexityAdjustment',@(t) .5*IRsigma^2.*t.^2))
bootModel =
			 Type: Forward
		   Settle: 733264 (10-Aug-2007)
	  Compounding: -1
			Basis: 0 (actual/actual)
	 InterpMethod: pchip
			Dates: [29x1 double]
			 Data: [29x1 double]
The bootstrap function uses an Optimization Toolbox™ function to solve for any bootstrapped rates.
Plot the forward and zero curves.
PlottingDates = (CurveSettle+20:30:CurveSettle+365*25)';
TimeToMaturity = yearfrac(CurveSettle,PlottingDates);
BootstrappedForwardRates = getForwardRates(bootModel, PlottingDates);
BootstrappedZeroRates = getZeroRates(bootModel, PlottingDates);

figure
hold on
plot(TimeToMaturity,BootstrappedForwardRates,'r')
plot(TimeToMaturity,BootstrappedZeroRates,'g')
title('Bootstrapped Curve')
xlabel('Time')
legend({'Forward','Zero'})
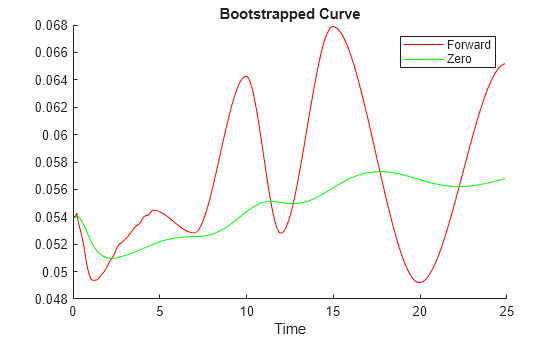
The plot demonstrates the forward and zero rate curves for the market data.
Bootstrap Swap Curve from Deposits, Eurodollar Futures, and Swaps Using InstrumentBasis for Each Instrument Type
This example shows how to bootstrap a swap curve from deposits, Eurodollar Futures, and swaps. The input market data for this example is hard-coded and specified as two cell arrays of data; one cell array indicates the type of instrument and the other contains the Settle, Maturity values, and a market quote for the instrument. This example of bootstrapping demonstrates the use of an InstrumentBasis for each Instrument type.
InstrumentTypes = {'Deposit';'Deposit';...
'Futures';'Futures';'Futures';'Futures';'Futures';'Futures';...
'Swap';'Swap';'Swap';'Swap';};

Instruments = [datenum('08/10/2007'),datenum('09/17/2007'),.0532000; ...
datenum('08/10/2007'),datenum('11/17/2007'),.0535866; ...
datenum('08/08/2007'),datenum('19-Dec-2007'),9485; ...
datenum('08/08/2007'),datenum('19-Mar-2008'),9502; ...
datenum('08/08/2007'),datenum('18-Jun-2008'),9509.5; ...
datenum('08/08/2007'),datenum('17-Sep-2008'),9509; ...
datenum('08/08/2007'),datenum('17-Dec-2008'),9505.5; ...
datenum('08/08/2007'),datenum('18-Mar-2009'),9501; ...
datenum('08/08/2007'),datenum('08/08/2014'),.0530; ...
datenum('08/08/2007'),datenum('08/08/2019'),.0551; ...
datenum('08/08/2007'),datenum('08/08/2027'),.0565; ...
datenum('08/08/2007'),datenum('08/08/2037'),.0566];

CurveSettle = datenum('08/10/2007');
The bootstrap function is called as a function of the IRBootstrapOptions object. Inputs to the bootstrap function include the curve Type (zero or forward), Settle date, InstrumentTypes, and Instrument data. The bootstrap function also supports optional arguments, including an interpolation method, compounding, basis, and an options structure for bootstrapping. In this example, you pass an additional Basis value for each InstrumentType.
bootModel=IRDataCurve.bootstrap('Forward',CurveSettle,InstrumentTypes, ...
Instruments,'InterpMethod','pchip','InstrumentBasis',[repmat(2,8,1);repmat(0,4,1)])
bootModel =
			 Type: Forward
		   Settle: 733264 (10-Aug-2007)
	  Compounding: 2
			Basis: 0 (actual/actual)
	 InterpMethod: pchip
			Dates: [12x1 double]
			 Data: [12x1 double]
The bootstrap function uses an Optimization Toolbox™ function to solve for any bootstrapped rates.
Plot the par yields curve using the getParYields function.
PlottingDates = (datenum('08/11/2007'):30:CurveSettle+365*25)';
plot(PlottingDates, getParYields(bootModel, PlottingDates),'r')
datetick
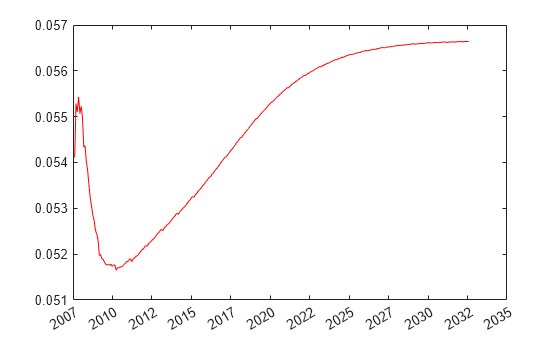
The plot demonstrates the par yields curve for the market data.
See Also
IRBootstrapOptions | IRDataCurve | IRFunctionCurve | IRFitOptions
Topics
- Creating Interest-Rate Curve Objects
- Bootstrapping a Swap Curve
- Dual Curve Bootstrapping
- Creating an IRFunctionCurve Object
- Fitting Interest-Rate Curve Functions
- Interest-Rate Curve Objects and Workflow
- Mapping Financial Instruments Toolbox Curve Functions to Object-Based Framework