Log Data for Histogram
To log data for histograms:
In the Fixed-Point Conversion window, click Run Simulation and select
Log data for histogram, and then click the Run Simulation button.The simulation runs and the simulation minimum and maximum ranges are displayed on the Variables tab. Using the simulation range data, the software proposes fixed-point types for each variable based on the default type proposal settings, and displays them in the Proposed Type column.
To view a histogram for a variable, click the variable’s Proposed Type field.
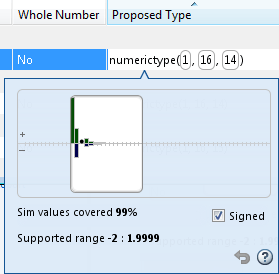
You can view the effect of changing the proposed data types by:
Selecting and dragging the white bounding box in the histogram window. This action does not change the word length of the proposed data type, but modifies the position of the binary point within the word so that the fraction length of the proposed data type changes.
Selecting and dragging the left edge of the bounding box to increase or decrease the word length. This action does not change the fraction length or the position of the binary point.
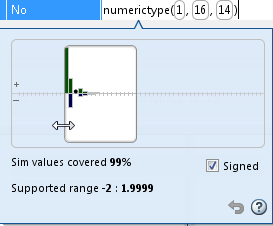
Selecting and dragging the right edge to increase or decrease the fraction length of the proposed data type. This action does not change the position of the binary point. The word length changes to accommodate the fraction length.
Selecting or clearing Signed. Clear Signed to ignore negative values.
Before committing changes, you can revert to the types proposed
by the automatic conversion by clicking ![]() .
.