spectrumoptions
Option set for spectrumplot
Description
opt = spectrumoptionsspectrumplot. Use
dot notation to customize the option set, if needed.
opt = spectrumoptions('identpref')
Examples
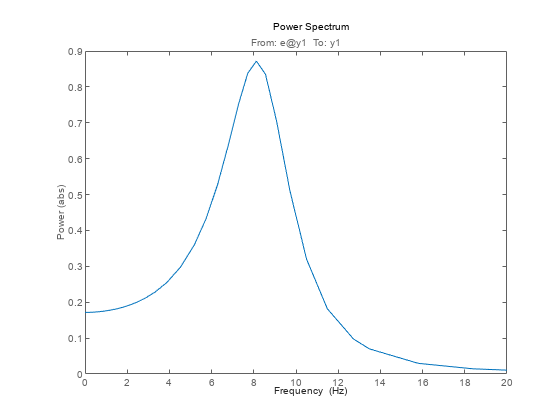
Specify the plot options.
plot_options = spectrumoptions;
plot_options.FreqUnits = 'Hz';
plot_options.FreqScale = 'linear';
plot_options.Xlim = {[0 20]};
plot_options.MagUnits = 'abs';
Estimate an AR model.
load iddata9 z9
sys = ar(z9,4);
Plot the output spectrum for the model.
spectrumplot(sys,plot_options);
opt = spectrumoptions('identpref');Output Arguments
Option set containing the specified options for spectrumplot.
| Field | Description |
|---|---|
|
Text and style for axes labels and plot title, specified as a structure array with the following fields:
|
TickLabel |
Tick label style, specified as a structure array with the following fields:
|
Grid |
Show or hide the grid, specified as one of the
following values: Default:
|
GridColor |
Color of the grid lines, specified as one of the
following: vector of RGB values in the range
Default:
|
XLimMode, YLimMode |
Axes limit modes, specified as one of the following values:
Default:
|
XLim, YLim | Axes limits, specified as an array of the form [min,max] |
IOGrouping |
Grouping of input-output pairs in the plot,
specified as one of the following values:
Default:
|
InputLabels, OutputLabels |
Input and output label styles, specified as a structure array with the following fields:
|
InputVisible, OutputVisible |
Visibility of input and output channels, specified
as one of the following values:
Default:
|
ConfidenceRegionNumberSD |
Number of standard deviations to use to plot the response confidence region. Default:
|
FreqUnits | Frequency units, specified as one of the following values:
Default: You
can also specify |
FreqScale |
Frequency scale, specified as one of the following
values: Default:
|
MagUnits |
Magnitude units, specified as one of the following
values: Default:
|
MagScale |
Magnitude scale, specified as one of the following
values: Default:
|
MagLowerLimMode |
Enables a lower magnitude limit, specified as one
of the following values: Default:
|
MagLowerLim | Lower magnitude limit, specified as data type double. |
Version History
Introduced in R2012a
See Also
MATLAB Command
You clicked a link that corresponds to this MATLAB command:
Run the command by entering it in the MATLAB Command Window. Web browsers do not support MATLAB commands.
Seleccione un país/idioma
Seleccione un país/idioma para obtener contenido traducido, si está disponible, y ver eventos y ofertas de productos y servicios locales. Según su ubicación geográfica, recomendamos que seleccione: .
También puede seleccionar uno de estos países/idiomas:
Cómo obtener el mejor rendimiento
Seleccione China (en idioma chino o inglés) para obtener el mejor rendimiento. Los sitios web de otros países no están optimizados para ser accedidos desde su ubicación geográfica.
América
- América Latina (Español)
- Canada (English)
- United States (English)
Europa
- Belgium (English)
- Denmark (English)
- Deutschland (Deutsch)
- España (Español)
- Finland (English)
- France (Français)
- Ireland (English)
- Italia (Italiano)
- Luxembourg (English)
- Netherlands (English)
- Norway (English)
- Österreich (Deutsch)
- Portugal (English)
- Sweden (English)
- Switzerland
- United Kingdom (English)