Detect Lines and Highlight Longest Segment Using Hough Transform
This example shows how to detect lines in an image using the Hough transform.
Read an image into the workspace. To make this example more illustrative, rotate the image 33 degrees counterclockwise about the center of the image. Display the rotated image.
I  = imread("circuit.tif");
Irot = imrotate(I,33,"crop");
imageshow(Irot)

Find and display the edges in the image.
BW = edge(Irot,"canny");
imageshow(BW)
Calculate the Hough transform using the binary image.
[H,theta,rho] = hough(BW);
The Hough matrix is of data type double with values outside the range [0, 1]. To display the Hough matrix, rescale the data to the range [0, 1]. Improve the image contrast by using the imadjust function.
Hdisp = rescale(H);
Hdisp = imadjust(Hdisp);
imshow(Hdisp,XData=theta,YData=rho)
xlabel("\theta")
ylabel("\rho")
axis on
axis normal
hold on
colormap(gca,hot)

Find the five largest peaks in the Hough transform of the image.
thresh = ceil(0.3*max(H(:)));
maxpeaks = 5;
peaks = houghpeaks(H,maxpeaks,Threshold=thresh);
Plot the peaks in blue over the Hough transform matrix.
t = theta(peaks(:,2));
r = rho(peaks(:,1));
plot(t,r,"s",Color="blue");
hold off

Find lines that have a length of at least 7 pixels. Before counting line lengths, fill in gaps that are smaller than 5 pixels.
lines = houghlines(BW,theta,rho,peaks,FillGap=5,MinLength=7);
Display the original image, then superimpose the detected lines in green on it. Also plot the beginning of each line in yellow and end of each line in red.
imshow(Irot)
hold on
for k = 1:length(lines)
   xy = [lines(k).point1; lines(k).point2];
plot(xy(:,1),xy(:,2),LineWidth=2,Color="green");
   plot(xy(1,1),xy(1,2),"x",LineWidth=2,Color="yellow");
   plot(xy(2,1),xy(2,2),"x",LineWidth=2,Color="red");
end
To determine the endpoints of the longest line segment, start by extracting the (x,y) coordinates of all of the first endpoints and second endpoints of the lines.
pt1 = [lines.point1];
pt2 = [lines.point2];
The endpoint coordinates are returned in a vector, in the form [x1 y1 x2 y2 ...]. Reshape the vector into a matrix with two rows representing the x coordinates and the y coordinates.
pt1 = reshape(pt1,[2 12]);
pt2 = reshape(pt2,[2 12]);
Calculate the vector-wise norm of the different between each pair of endpoints, which indicates the length of each line. Then, find the index of the longest line.
len = vecnorm(pt1-pt2);
[m,idx] = max(len);
Highlight the longest line segment by coloring it cyan.
xy = [lines(idx).point1; lines(idx).point2];
plot(xy(:,1),xy(:,2),LineWidth=2,Color="cyan");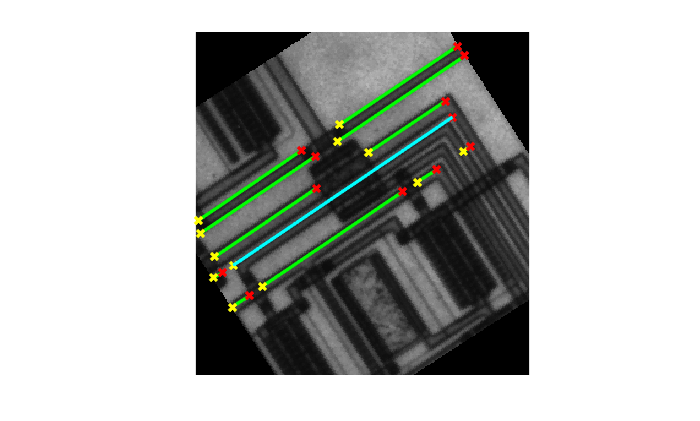
See Also
hough | houghlines | houghpeaks