Contenido principal

OPDMapChart

R2026b

2-D map chart of OPD

Since R2026b

Description

Add-On Required: This feature requires the Optical Design and Simulation Library for Image Processing Toolbox add-on.

An OPDMapChart object stores information used to display a 2-D optical path difference (OPD) map. You can change aspects of the display, such as the title, by modifying properties of the OPDMapChart object.

Creation

Create an OPDMapChart object by using the show function with an OPD object and specifying the Style argument as "map".

Properties

expand all

OPD results, specified as an N-by-M array of OPD objects. N is the number of field points and M is the number of wavelengths for which OPD has been computed.

This property is read-only.

OPD map image data in waves, represented as an N-by-M cell array. Each element contains a numPointsPerAxis-by-numPointsPerAxis matrix that represents the OPD map image in waves, computed using interpolation from traced ray data. numPointsPerAxis is the number of uniformly spaced sample points along each pupil axis used to compute the OPD map image.

Chart title, specified as a string scalar or character vector.

Data Types: char | string

Parent UI container, specified as a Figure object, Panel object, GridLayout object, Tab object, or TiledChartLayout object. If you do not specify this property, MATLAB creates a new figure. You can create these UI containers using their respective creation functions.

Examples

collapse all

Import a double Gauss lens optical system from a ZMX file into the workspace.

opsys = zmximport("DoubleGaussLens.zmx");

Compute the OPD at the primary wavelength of the optical system.

opdr = opd(opsys,Wavelengths=opsys.PrimaryWavelength);

Display the OPD results as a map chart.

hfan = show(opdr,Style="map");
title("OPD Map")
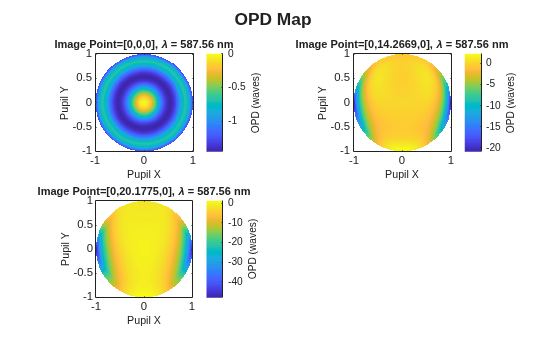
Figure contains an object of type optics.chart.opdmapchart. The chart of type optics.chart.opdmapchart has title OPD Map.

More About

expand all

Version History

Introduced in R2026b