Contenido principal

OPD

R2026b

Optical path difference result for optical system

Since R2026b

Description

Add-On Required: This feature requires the Optical Design and Simulation Library for Image Processing Toolbox add-on.

An OPD object stores the result of the optical path length (OPL) and optical path difference (OPD) analysis for an optical system.

You can visualize the OPD results as either an OPD fan chart or an OPD map in 2-D by using the show object function.

Creation

Create an OPD object by using the opd object function of the opticalSystem object.

Properties

expand all

This property is read-only.

Optical path difference values, represented as a numRays-by-1 numeric vector. Units are in millimeters. numRays is the number of rays that reached the last surface of the optical system. The maximum value of numRays is the number of points in the sampling grid, which you can determine from the SamplingGrid argument used to create this object.

Note

The RMS and PeakToValley properties store wavefront error in waves, not millimeters. To convert raw OpticalPathDifference values to waves, divide by the wavelength in millimeters (Wavelength * 1e-6).

Data Types: double

This property is read-only.

Optical path length values, represented as a numRays-by-1 numeric vector. Units are in millimeters. numRays is the number of rays that reached the last surface of the optical system. The maximum value of numRays is the number of points in the sampling grid, which you can determine from the SamplingGrid argument used to create this object.

Data Types: double

This property is read-only.

Normalized pupil coordinates, represented as a numRays-by-2 numeric matrix. numRays is the number of rays that reached the last surface of the optical system. Each row of the matrix contains the normalized xy-coordinates of the aberrated entrance pupil through which the rays have been traced.

Data Types: double

This property is read-only.

Source field point of the ray bundle, represented as a FieldAngle or FieldPosition object.

This property is read-only.

Wavelength of light, represented as a positive scalar. Units are in nanometers.

Data Types: double

This property is read-only.

Reference sphere information for OPD computation, represented as a structure with these fields:

  • Center — 1-by-3 vector representing the center of the reference sphere in global coordinates.

  • ReferencePlanePoint — 1-by-3 vector representing where the chief ray intersects the reference plane in global coordinates.

For telecentric systems, both fields contain [NaN NaN NaN].

This property is read-only.

Reference plane information for OPD computation, represented as a structure with these fields:

  • Normal — 1-by-3 unit normal vector of the reference plane in global coordinates.

  • Point — 1-by-3 vector representing where the chief ray intersects the reference plane in global coordinates.

This property is read-only.

RMS wavefront error, represented as a numeric scalar. Units are in waves. The RMS wavefront is the standard deviation of the optical path difference values.

Data Types: double

This property is read-only.

Peak-to-valley wavefront error, represented as a numeric scalar. Units are in waves. The peak-to-valley value is the difference between the maximum and minimum optical path difference values.

Data Types: double

Object Functions

showPlot analysis result

Examples

collapse all

Import a double Gauss lens optical system from a ZMX file into the workspace.

opsys = zmximport("DoubleGaussLens.zmx");

Create a hexapolar sampling grid.

sg = samplingGrid("Hexapolar",30);

Trace rays through the optical system.

rb = traceRays(opsys,SamplingGrid=sg);

Compute the OPD using data from the ray bundle.

opdr = opd(opsys,rb);

Display the OPD results as a fan chart.

hfan = show(opdr,Legend="off");
title("Wavefront Error")
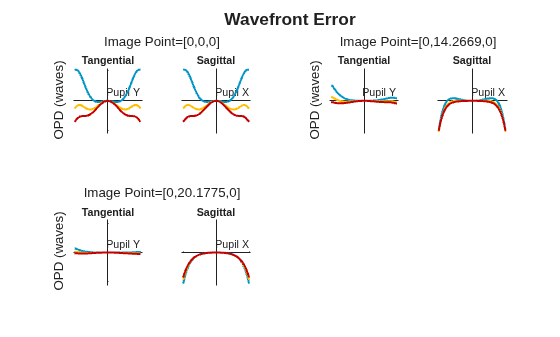
Figure contains an object of type optics.chart.opdfanchart. The chart of type optics.chart.opdfanchart has title Wavefront Error.

Version History

Introduced in R2026b