PSFImage
R2026bDescription
Add-On Required: This feature requires the Optical Design and Simulation Library for Image Processing Toolbox add-on.
A PSFImage object displays point spread function (PSF) image
data for one or more PSF result objects.
Use a PSFImage chart to visualize geometric or Huygens PSF intensity
images, select wavelength channels, combine wavelength channels, and customize the display
colormap.
Creation
Create a PSFImage object by using the show object
function of an GeometricPSF or HuygensPSF object. Create a
PSF result object by using the psf object
function.
hpsf = show(psfr)
You can specify chart properties when you call show.
hpsf = show(psfr,CombineWavelengths="off",WavelengthIndices=[1 3])Properties
Examples
Load the sample Double Gauss lens system using zmximport. Define a field point at an angle of 4 degrees along the x-axis, specify a wavelength of 587.56 nm, and calculate the geometric PSF.
opsys = zmximport("DoubleGaussLens.zmx");
fp = fieldPoint(Angles=[0 4]);
lambda = 587.56;
psfr = psf(opsys, FieldPoints=fp, Wavelengths=lambda, Method="Geometric");
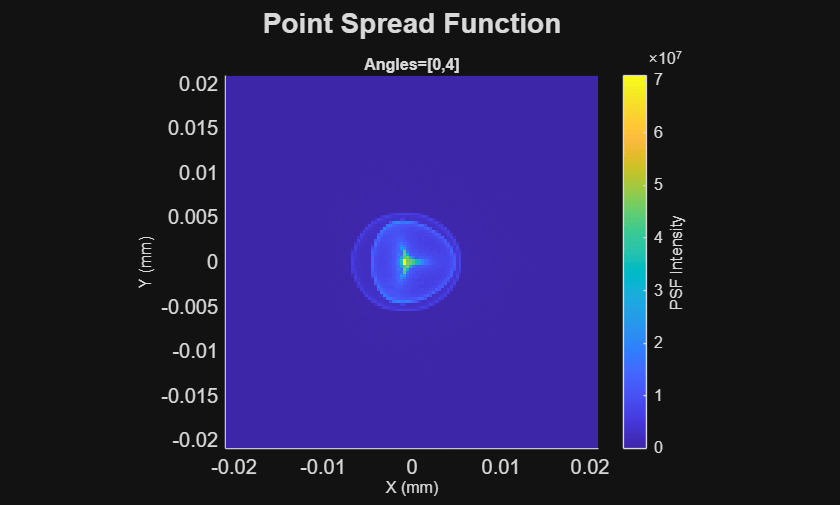
Visualize the computed point spread function by passing the result object to the show function. The function renders the intensity profile and returns a chart handle for further customization.
hpsf = show(psfr)
hpsf =
  PSFImage with properties:

                 Title: "Point Spread Function"
                   PSF: [1×1 optics.result.GeometricPSF]
    CombineWavelengths: on
     WavelengthIndices: 1
              Colormap: [256×3 double]
              Position: [0.1143 0.1126 0.7524 0.7381]
                 Units: 'normalized'

  Show all properties
Load the sample Double Gauss lens system using zmximport. Define a field point at an angle of 4 degrees along the x-axis and specify an array of three wavelengths (486.13 nm, 587.56 nm, and 656.28 nm).
opsys = zmximport("DoubleGaussLens.zmx");
fp = fieldPoint(Angles=[0 4]);
lambdas = [486.13 587.56 656.28];
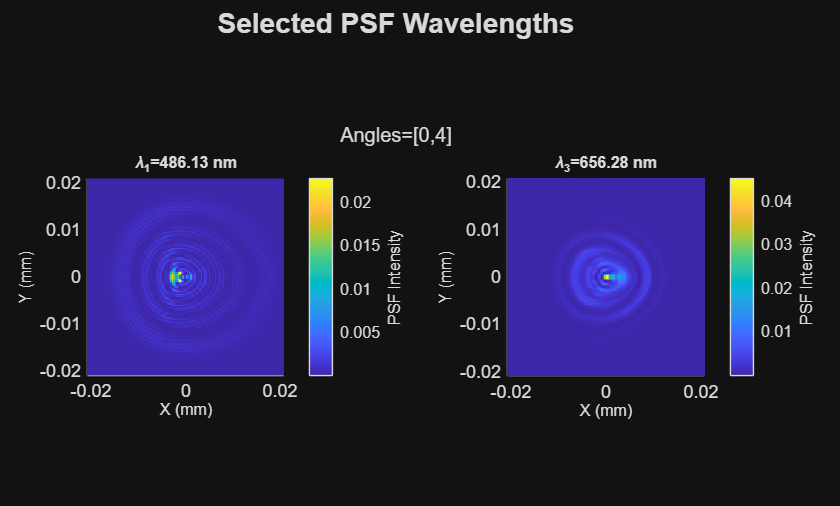
Compute the Huygens PSF across all specified wavelengths. Use the show function to display the intensity distributions. Set the CombineWavelengths name-value argument to "off" to render the channels in separate tiles, and use WavelengthIndices to isolate the first and third wavelengths. Customize the chart appearance by modifying its Title and Colormap properties.
psfr = psf(opsys, FieldPoints=fp, Wavelengths=lambdas, Method="Huygens");
hpsf = show(psfr, CombineWavelengths="off", WavelengthIndices=[1 3]);
hpsf.Title = "Selected PSF Wavelengths";
hpsf.Colormap = hot(256);
More About
Version History
Introduced in R2026b
See Also
psf | GeometricPSF | HuygensPSF | centroid | encircledEnergyAtRadius | radiusAtEncircledEnergy | show

