OpticalThroughput
R2026bDescription
Add-On Required: This feature requires the Optical Design and Simulation Library for Image Processing Toolbox add-on.
An OpticalThroughput object stores the optical throughput
efficiency data of an optical system for a rendered test chart scene.
Creation
You cannot create an OpticalThroughput object directly. Access the
object by extracting the OpticalThroughput property of a SimulatedESFRChart or SimulatedColorCheckerChart object.
Properties
Examples
Create an optical system that contains a double Gauss lens using the createDoubleGauss helper function. The function is attached to this example as a supporting file.
opsys = createDoubleGauss;
Add an image sensor to the optical system, and focus the optical system.
addImageSensor(opsys)
focus(opsys)
Render a ColorChecker test chart through the focused optical system.
chart = renderChart(opsys);
Display the simulated ColorChecker test chart with ROI annotations overlaid on the chart.
displayChart(chart)
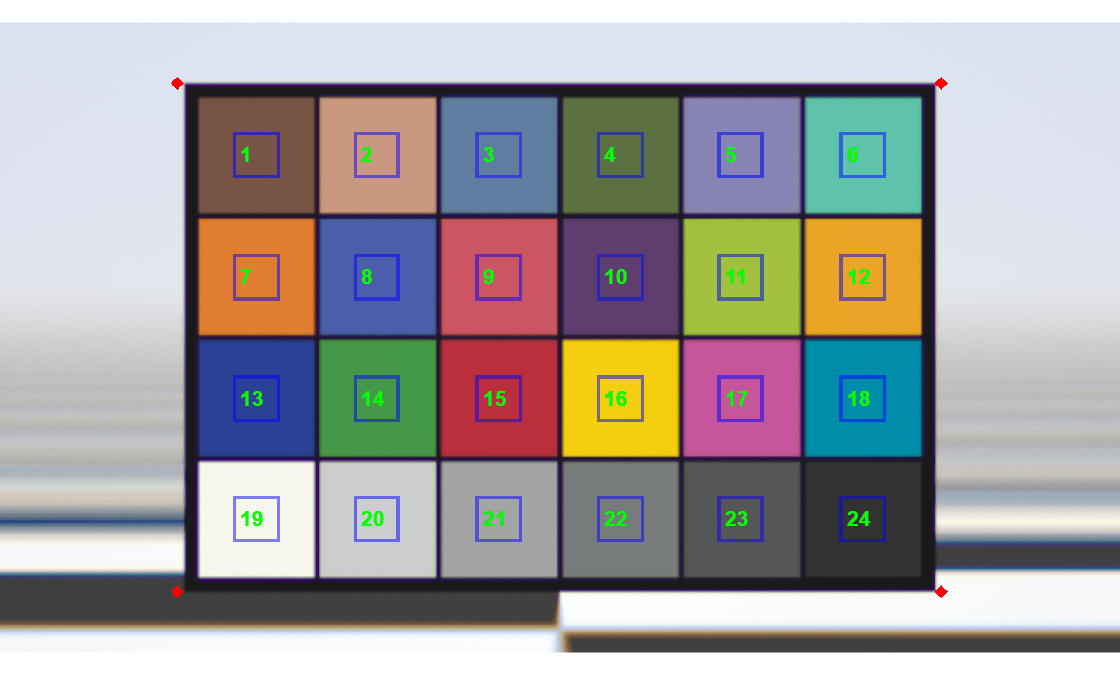
To assess the light‑collection efficiency across the field for this optical system, display the optical throughput data.
chart.OpticalThroughput
ans =
  OpticalThroughput with properties:

     Throughput: [720×1280×36 double]
    Wavelengths: [380 390 400 410 420 430 440 450 460 470 480 490 500 510 520 530 540 550 560 570 580 590 600 610 620 630 640 650 660 670 680 690 700 710 720 730]
       Detector: [1×1 optics.detector.ImageSensor]
Algorithms
The function computes the optical throughput as:
where:
R— Scene spectral reflectance at ray intersection, in the range of (0, 1).— Lambertian normalization constant (projected solid angle of hemisphere).
T— System spectral transmittance, accounting for Fresnel losses, absorption, and other transmission losses.— Tilt factor originating from the ray angle of incidence at the sensor.
— Exit pupil solid angle as seen from the pixel location.
Version History
Introduced in R2026b

