Contenido principal

SimulatedColorCheckerChart

R2026b

Simulated ColorChecker test chart

Since R2026b

Description

Add-On Required: This feature requires the Optical Design and Simulation Library for Image Processing Toolbox add-on.

A SimulatedColorCheckerChart object stores a ColorChecker test chart rendered through an optical system. To display the rendered chart image, use the imageshow function. To display the chart image with registration points and color ROI overlays, use the displayChart object function.

You can perform color accuracy analysis of the simulated ColorChecker chart using object functions.

  • To apply a different gain as a postprocessing step when comparing rendered images across system configurations, use the refreshImage object function.

  • To measure color accuracy, and get the color measurements for each patch, use the measureColor object function.

  • To estimate the scene illuminant based on the gray patches in the chart, use the measureIlluminant object function.

Creation

Create a SimulatedColorCheckerChart object by rendering a simulated ColorChecker test chart through an optical system using the renderChart function.

Properties

expand all

Image representation of the rendered chart, represented as an m-by-n-by-3 numeric array. The rendered image is converted to the sRGB (D65) color space for display.

The sizes of the first two dimensions must match the sizes of the first two dimensions of the OpticalThroughput property.

Data Types: uint8

This property is read-only.

Image gain factor, represented as a positive scalar. This multiplicative gain is applied to the image for exposure adjustment. The default value is automatically computed to the maximum value that prevents clipping in sRGB space.

Data Types: double

This property is read-only.

Optical throughput data, represented as an OpticalThroughput object. This object contains information about the optical throughput efficiency of the system for the rendered chart scene.

This property is read-only.

Physical chart width, represented as a positive scalar. Units are in millimeters.

Data Types: double

This property is read-only.

Physical chart height, represented as a positive scalar. Units are in millimeters.

Data Types: double

This property is read-only.

Positions of the registration points used to orient the image, represented as a 4-by-2 numeric matrix. The four rows correspond to the top-left, top-right, bottom-right, and bottom-left registration points, respectively. The two columns represent pixel coordinates in [x y] format. The SimulatedColorCheckerChart object uses these points for chart registration and alignment.

Data Types: double

This property is read-only.

Reference LAB values for the color patches, represented as a 24-by-3 numeric matrix. The three columns contain the L*, a*, and b* values, respectively. The rows contain the reference values of the 24 color patches, in sequential order.

Data Types: double

This property is read-only.

Reference illuminant for LAB values, represented as "d65".

Data Types: string

This property is read-only.

Region of interest data for the color patches, represented as a 24-element structure array. Each element in the array corresponds to one color patch ROI and contains these fields:

FieldDescription
ROI Spatial extent of the ROI, represented as a 1-by-4 vector of the form [X Y Width Height]. X and Y are the coordinates of the top-left corner of the ROI. Width and Height are the width and height of the ROI, in pixels. ROI is of data type double.
ROIIntensity Array of color values within the ROI, in RGB format. The array has dimensions Height-by-Width-by-3. The data type of ROIIntensity is uint8.

This property is read-only.

Three-dimensional position of the chart, represented as a 1-by-3 numeric vector of the form [x y z]. Units are in millimeters. This is the position of the chart center in global coordinates.

Data Types: double

Object Functions

refreshImageApply postprocess gain to rendered test chart
measureColorMeasure color reproduction using test chart
measureIlluminantMeasure scene illuminant using test chart
displayChartDisplay test chart with overlaid regions of interest

Examples

collapse all

Create an optical system that contains a double Gauss lens using the createDoubleGauss helper function. The function is attached to this example as a supporting file.

opsys = createDoubleGauss;

Add an image sensor to the optical system, and focus the optical system.

addImageSensor(opsys)
focus(opsys)

Render a ColorChecker test chart through the focused optical system.

chart = renderChart(opsys);

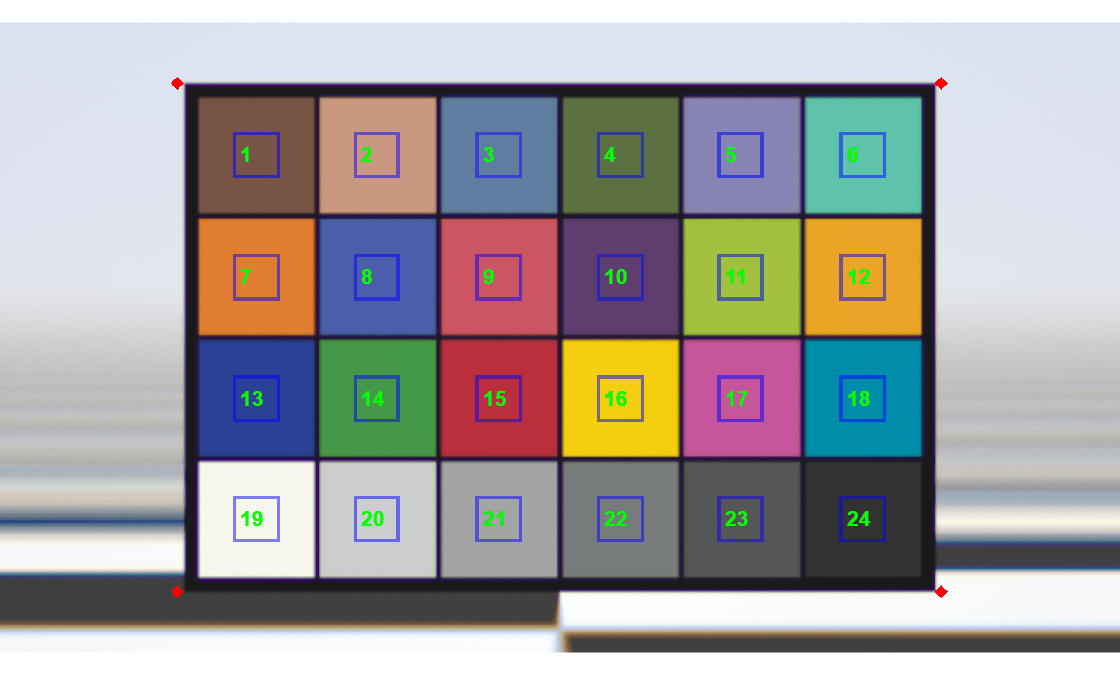
Display the simulated ColorChecker test chart with ROI annotations overlaid on the chart.

displayChart(chart)
To assess the light‑collection efficiency across the field for this optical system, display the optical throughput data.

chart.OpticalThroughput
ans = 
  OpticalThroughput with properties:

     Throughput: [720×1280×36 double]
    Wavelengths: [380 390 400 410 420 430 440 450 460 470 480 490 500 510 520 530 540 550 560 570 580 590 600 610 620 630 640 650 660 670 680 690 700 710 720 730]
       Detector: [1×1 optics.detector.ImageSensor]

More About

expand all

References

[1] Myers, Robin D. “Chromaxion: Spectral Library.” Chromaxion, 2025. https://www.chromaxion.com/spectral-library.php. Accessed 21 Apr. 2026.

Version History

Introduced in R2026b