Waveform Generation and Transmission Using LTE Toolbox with Test and Measurement Equipment
This example shows how to generate and analyze an over-the-air LTE waveform by using the LTE Toolbox™, the Instrument Control Toolbox™ and a Keysight Technologies® RF signal generator and analyzer.
Introduction
The LTE Toolbox can be used to generate standard baseband IQ downlink test model (E-TM) waveforms and uplink and downlink reference measurement channel (RMC) waveforms. Using the LTE Toolbox with the Instrument Control Toolbox allows LTE waveforms created in MATLAB® to be used with test and measurement hardware. Waveforms created by the LTE Toolbox can be modulated for transmission using a signal generator. Waveforms captured using a signal analyzer can be analyzed using MATLAB and LTE Toolbox functions.
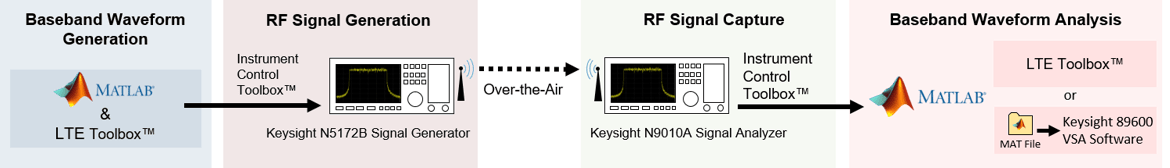
In this example the Instrument Control Toolbox is used to interface with an RF signal generator and analyzer. An E-TM waveform, synthesized in MATLAB using the LTE Toolbox, is downloaded to a Keysight Technologies N5172B signal generator for over-the-air transmission. The over-the-air signal is captured using a Keysight Technologies N9010A signal analyzer and retrieved into MATLAB for analysis.
The captured waveform can be analyzed using the LTE Toolbox as demonstrated in the following examples:
This example illustrates how external test and measurement equipment can be used to analyze the received waveform; in this case Keysight Technologies Vector Signal Analysis (VSA) software is also used.
Generate a Baseband Waveform Using the LTE Toolbox
The LTE Toolbox provides GUIs and functions that generate test model waveforms as per [ 1 ]. lteTestModelTool can be used to configure and create the signal using a GUI.
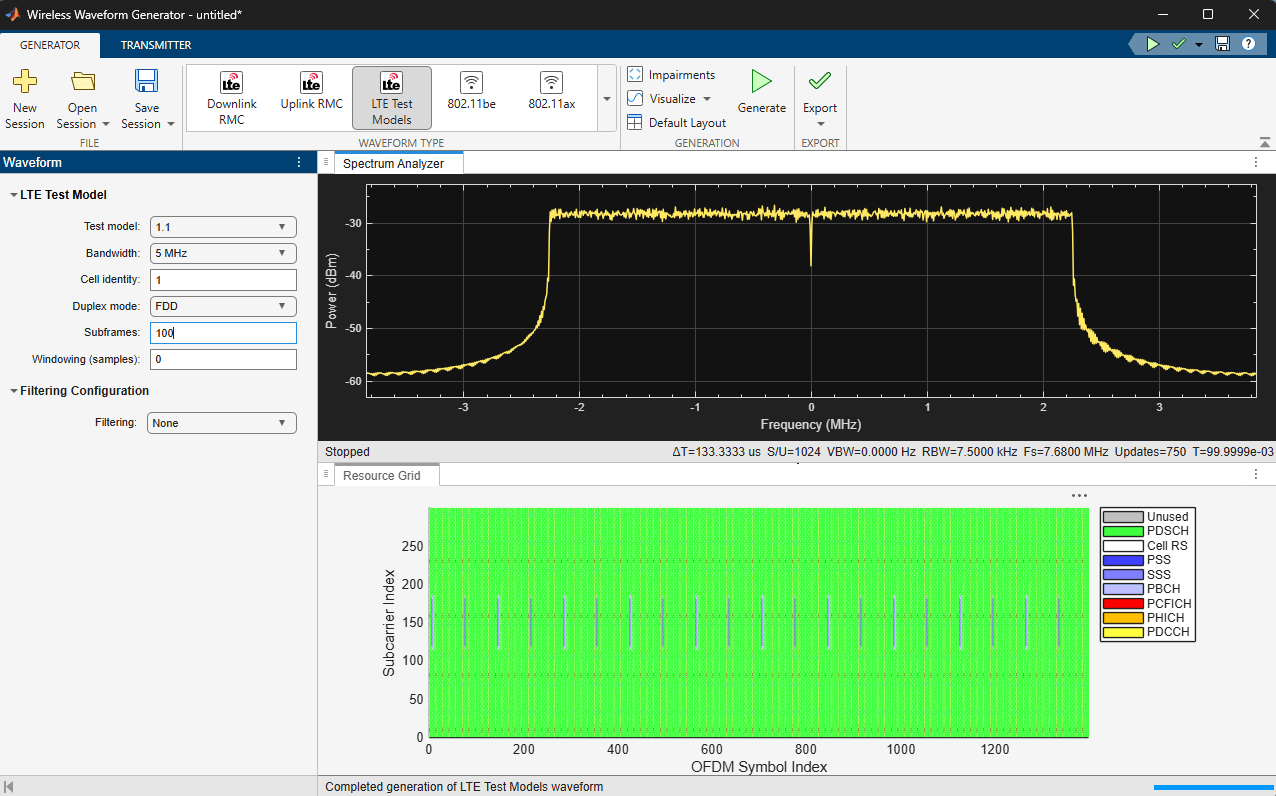
Alternatively, the functions lteTestModel and lteTestModelTool allow the programmatic configuration and generation of LTE test models and baseband IQ waveforms.
config = lteTestModel('1.1', '5MHz');  % Test Model 1.1, 5MHz bandwidth
config.TotSubframes = 100;             % Generate 100 subframes
[waveform, tmgrid, config] = lteTestModelTool(config);
For more details on the LTE test model signal, refer to the accompanying LTE Downlink Test Model (E-TM) Waveform Generation example.
The frequency spectrum of the generated time-domain waveform, waveform, can be viewed using the DSP System Toolbox spectrumAnalyzer object. As expected, the 5MHz signal bandwidth is clearly visible at baseband.
% Calculate the spectral content in the LTE signal
spectrumPlotTx = spectrumAnalyzer;
spectrumPlotTx.SampleRate = config.SamplingRate;
spectrumPlotTx.SpectrumType = 'power-density';
spectrumPlotTx.SpectrumUnits =  'dBm';
spectrumPlotTx.RBWSource = 'Property';
spectrumPlotTx.RBW = 15e3;
spectrumPlotTx.FrequencySpan = 'span-and-center-frequency';
spectrumPlotTx.Span = 7.68e6;
spectrumPlotTx.CenterFrequency = 0;
spectrumPlotTx.Window = 'rectangular';
spectrumPlotTx.YLimits = [-100 -60];
spectrumPlotTx.YLabel = 'PSD';
spectrumPlotTx.Title = 'Test Model E-TM1.1, 5 MHz Signal Spectrum';
spectrumPlotTx.ShowLegend = false;
spectrumPlotTx(waveform);

Generate an Over-the-Air Signal Using an RF Signal Generator
The Instrument Control Toolbox is used to download and play the test model waveform created by the LTE Toolbox, waveform, using the Keysight Technologies N5172B signal generator. This creates an RF LTE signal with a center frequency of 1GHz. Note 1GHz was selected as an example frequency and is not intended to be a recognized LTE channel.
% Download the baseband IQ waveform to the instrument. Generate the RF
% signal at a center frequency of 1GHz and output power of 0dBm.
power = 0;       % Output power
loopCount = Inf; % Number of times to loop

% Configure the signal generator, download the waveform and loop
rf = rfsiggen('TCPIP0::A-N5172B-50283.dhcp.mathworks.com::inst0::INSTR');
download(rf,waveform.',config.SamplingRate);
start(rf,1e9,power,loopCount);
Inspect the RF signal generator object rfsiggen (Instrument Control Toolbox) for more details on the commands used to download and play the waveform.
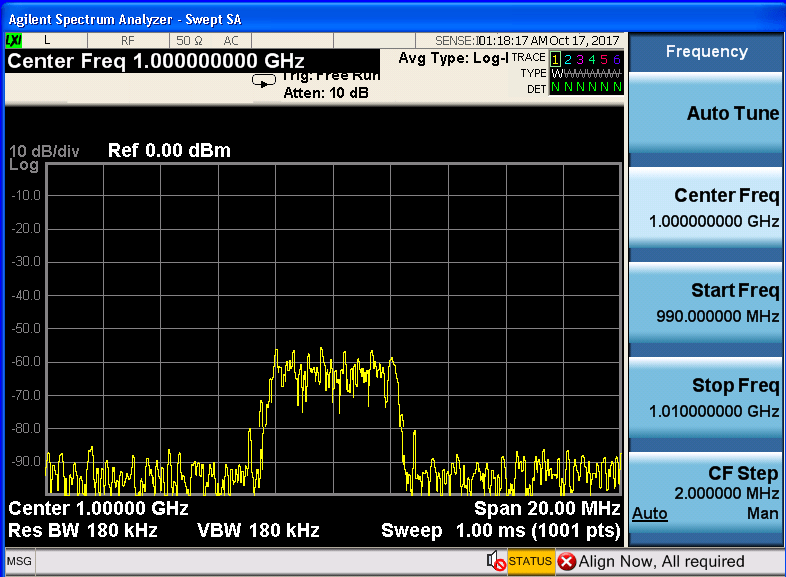
The frequency spectrum of the RF signal transmitted by the signal generator can be viewed using a spectrum analyzer tuned to the 1GHz center frequency. The screen capture below, from a Keysight Technologies N9010A signal analyzer, clearly shows the 5MHz signal bandwidth.
Acquire the Baseband Signal in MATLAB from a Signal Analyzer
To analyze the over-the-air transmission in MATLAB, the Instrument Control Toolbox is used to configure the Keysight Technologies N9010A signal analyzer and capture baseband IQ data. The helper function hCaptureIQUsingN9010A.m retrieves the baseband IQ data, IQData, and the sample rate, sampleRate, from the signal analyzer, ready for analysis in MATLAB.
[IQData, sampleRate] = hCaptureIQUsingN9010A( ...
    'A-N9010A-21026.dhcp.mathworks.com', config.TotSubframes*1e-3, ...
    1e9, 5e6, false, 990e6, 1010e6, 200e3, 200e3);
Inspect the function hCaptureIQUsingN9010A.m for more details on input parameters and the commands needed to configure the Keysight Technologies N9010A signal analyzer and retrieve the data.
% When finished transmitting and receiving, stop the waveform output
stop(rf);
disconnect(rf);
clear rf;
Once the captured baseband IQ data, IQData, is acquired from the signal analyzer into MATLAB using Instrument Control Toolbox, custom visualization, analysis and decoding of the acquired baseband signal can be immediately performed on the data within MATLAB using the LTE Toolbox, Communications Toolbox™ and DSP System Toolbox. The data can also be stored in a MAT file for post-data analysis in MATLAB. In this example, the baseband IQ data is stored in a MAT file along with system parameters for use with Keysight Technologies VSA software.
Note the returned sampling rate from the instrumentation hardware is different than the configured sampling rate. The returned sample rate is valid for measurements using Keysight Technologies VSA software, but actual signal decoding would require a resampling of the acquired data.
% MAT file interface parameters
FreqValidMax = 1.010e9;
FreqValidMin = 9.90e8;
InputCenter = 1e9;
XDelta = 1/sampleRate;
Y = IQData;

% Common set with fixed values
IQ = 0;
InputRefImped = 50;
InputZoom = 1;
XDomain = 2;
XStart = 0;
XUnit = 'Sec';
YUnit = 'V';

% Save the variables for subsequent up-loading into VSA.
save('DownlinkTestModel1p1FDD5MHz_Rx.mat', 'FreqValidMax', 'FreqValidMin',...
     'IQ', 'InputCenter', 'InputRefImped', 'InputZoom', 'XDelta', ...
     'XDomain', 'XStart', 'XUnit', 'Y', 'YUnit');
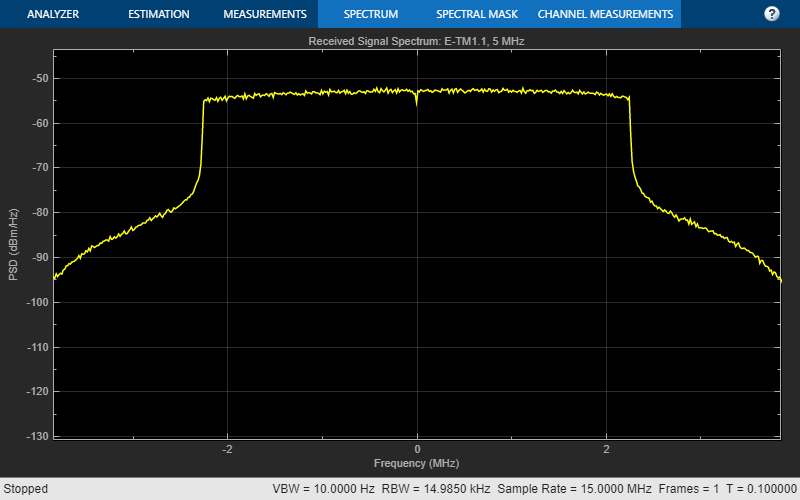
Plotting the frequency spectrum of the retrieved time-domain baseband waveform, Y, using the spectrumAnalyzer object shows the expected 5MHz occupied bandwidth, with impairments due to RF transmission and reception.
spectrumPlotRx = spectrumAnalyzer;
spectrumPlotRx.SampleRate =  1/XDelta;
spectrumPlotRx.SpectrumType = 'power-density';
spectrumPlotRx.SpectrumUnits =  'dBm';
spectrumPlotRx.RBWSource = 'property';
spectrumPlotRx.RBW = 15e3;
spectrumPlotRx.FrequencySpan = 'span-and-center-frequency';
spectrumPlotRx.Span = 7.68e6;
spectrumPlotRx.CenterFrequency = 0;
spectrumPlotRx.Window = 'rectangular';
spectrumPlotRx.YLabel = 'PSD';
spectrumPlotRx.Title = 'Received Signal Spectrum: E-TM1.1, 5 MHz';
spectrumPlotRx.ShowLegend = false;
spectrumPlotRx(Y);
release(spectrumPlotRx)
Analyze the Received LTE Signal
The captured waveform can be analyzed using the LTE Toolbox as demonstrated in the following examples:
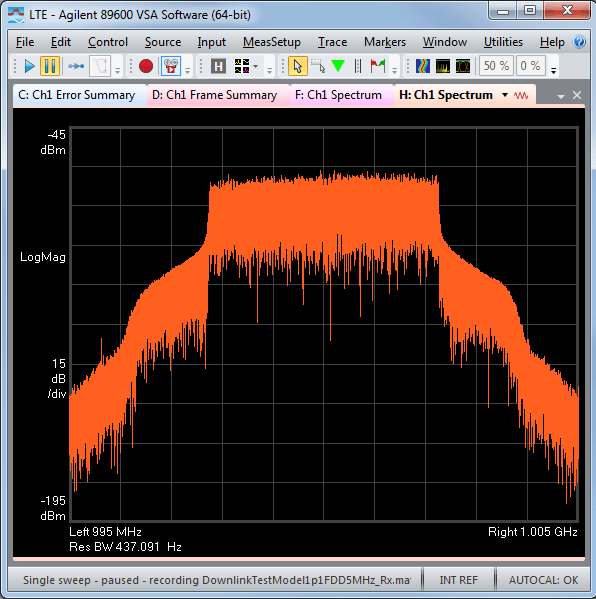
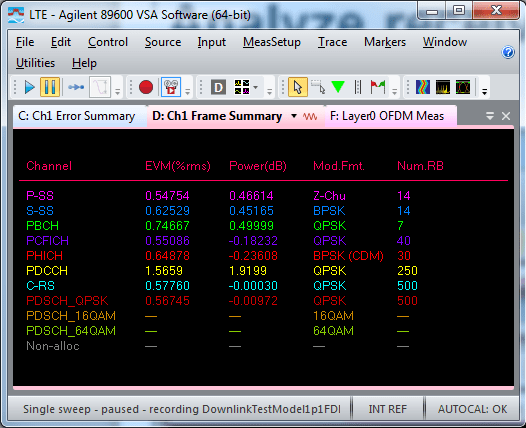
The MAT file containing the retrieved data is loaded into Keysight Technologies VSA software and LTE-specific measurements are made. The screenshots of the interactive displays from the VSA software confirms the waveform characteristics of the E-TM1.1 test model in terms of the occupied bandwidth, number of resource blocks used per channel and signal, their corresponding power levels and low EVM values.
Appendix
This example uses this helper function.
Selected Bibliography
3GPP TS 36.141 "Base Station (BS) conformance testing"