Animate Data from WMS Layers
Create Movie of WMS Maps
You can create maps of the same geographic region at different times and view them as a movie. For a period of twelve months, read and display an image from NOAA’s Environmental Research Division Data Access Program (ERDDAP).
Create a WebMapServer object using a WMS server from NOAA's Environmental Research Division Data Access Program (ERDDAP).
serverURL = "https://coastwatch.pfeg.noaa.gov/erddap/wms/NOAA_DHW/request?";
server = WebMapServer(serverURL);
Get a list of layers from the server by accessing the capabilities document.
capabilities = getCapabilities(server);
layers = capabilities.Layer;
Refine the list of layers to include sea surface temperatures and a land mask.
sst = refine(layers,"dhw_5km:CRW_SST",MatchType="exact");
mask = refine(layers,"LandMask",MatchType="exact");
sstMask = [sst mask];
Create a WMSMapRequest object from the layers and the server.
mapRequest = WMSMapRequest(sstMask,server);
The Extent field provides information about how to retrieve individual frames. For the layer of sea surface temperatures, the Extent field contains a list of comma-separated time requests. Convert the time requests to a datetime array, then view the first 5 requests.
framedata = string(sst.Details.Dimension.Extent);
dates = split(framedata,",");
timeRequests = datetime(dates,InputFormat="uuuu-MM-dd'T'HH:mm:ss'Z'");
timeRequests(1:5)
ans = 5×1 datetime
   01-Apr-1985 12:00:00
   02-Apr-1985 12:00:00
   03-Apr-1985 12:00:00
   04-Apr-1985 12:00:00
   05-Apr-1985 12:00:00
The output suggests that the layer provides data on a daily basis, starting on April 1, 1985. Specify a time request for the first day of every month in 2024.
timeRequests = datetime(2024,1:12,1)
timeRequests = 1×12 datetime
   01-Jan-2024   01-Feb-2024   01-Mar-2024   01-Apr-2024   01-May-2024   01-Jun-2024   01-Jul-2024   01-Aug-2024   01-Sep-2024   01-Oct-2024   01-Nov-2024   01-Dec-2024
Prepare to create a video by creating a VideoWriter object. Specify the rate of video playback in frames per second. Then, open the video file for writing.
videoFilename = "sst2024.avi";
writer = VideoWriter(videoFilename);
writer.FrameRate = 1;
writer.open;
Create a figure and axesm-based map to use for each frame of the video. Remove the meridian and parallel labels from the map.
fig = figure;
worldmap(mapRequest.Latlim,mapRequest.Lonlim);
mlabel off
plabel off
Hide the figure while populating the frames by setting the Visible property to "off".
fig.Visible = "off";Populate the frames. For each day in timeRequests:
Update the map request to request data for the specified day.
Get the URL of the map request.
Read an image and raster reference object from the map request.
Display the image and date on the
axesm-based map.Write the frame to the video.
If MATLAB® issues an error, skip the frame and display a message.
for t = timeRequests
    try
        % request data for specified day
        mapRequest.Time = datenum(t);

        % get URL of map request
        url = mapRequest.RequestURL;

        % read image and reference object from map request
        A = getMap(server,url);
        R = mapRequest.RasterReference;

        % display data on map
        geoshow(A,R)
        title(string(t))

        % write frame to video
        frame = getframe(fig);
        writer.writeVideo(frame);

    catch e
        % if MATLAB issues error, skip the frame
        fprintf(['Error: %s.\n', ...
            'Ignoring frame for %s.\n'], ...
            e.message,t)
    end
end
Close the video file for writing.
writer.close
View the video in MATLAB. Prepare to view the video by creating a VideoReader object. Read the frames from the video into an array. The array is an H-by-W-by-3-by-F array, where H is the height of the image, W is the width of the image, and F is the number of frames.
vid = VideoReader(videoFilename);
vidFrames = read(vid);
Preallocate a structure array to store the movie frames.
numFrames = vid.NumFrames;
frames(numFrames) = struct("cdata",[],"colormap",[]);
Store each frame in an element of the structure array.
for idx = 1:numFrames
    frames(idx).cdata = vidFrames(:,:,:,idx);
    frames(idx).colormap = [];
end
Set the Visible property of the figure to "on". Play the movie once at 2 frames per second.
fig.Visible = "on";
movie(fig,frames,1,2)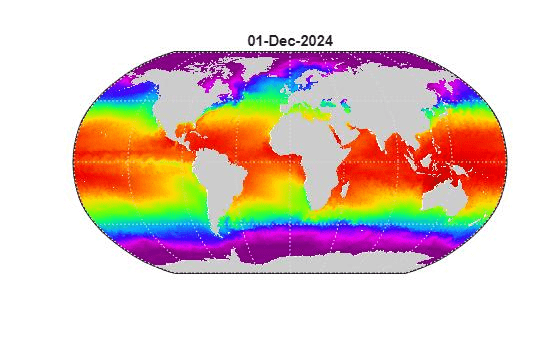
Create Animated GIF of WMS Maps
Read and display an animation of the Larsen Ice Shelf experiencing a dramatic collapse between January 31, 2002 and March 7, 2002.
Search the WMS Database for the phrase 'Larsen Ice Shelf'.
iceLayer = wmsfind('Larsen Ice Shelf');Create a WebMapServer by specifying the server URL of the first layer. Synchronize the layer with the server by using the updateLayers function.
server = WebMapServer(iceLayer(1).ServerURL);
iceLayer = updateLayers(server,iceLayer(1));
Create a WMSMapRequest object.
request = WMSMapRequest(iceLayer(1),server);
The Extent field provides the available values for a dimension, in this case time. Set the value of the extent to a variable. Calculate the number of required frames.
extent = string(iceLayer.Details.Dimension.Extent);
extent = split(extent,",");
numFrames = numel(extent);
Create a figure and set up a map with appropriate geographic limits. Customize the appearance of the parallels and meridians.
f = figure;
worldmap(request.Latlim,request.Lonlim)
setm(gca,'MLineLocation',1,'MLabelLocation',1, ...
   'MLabelParallel',-67.5,'LabelRotation','off');
Initialize the value of animated to 0.
animated(1,1,1,numFrames) = 0;
Set the Visible property of the figure to 'off' to hide the map while populating the frames. Read the image of the Larsen Ice Shelf on different days.
f.Visible = 'off';
for k=1:numFrames
   request.Time = extent(k);
   iceImage = getMap(server,request.RequestURL);
   geoshow(iceImage,request.RasterReference)
   title(request.Time,'Interpreter','none')
   frame = getframe(f);
   if k == 1
      [animated, cmap] = rgb2ind(frame.cdata,256,'nodither');
   else
      animated(:,:,1,k) = rgb2ind(frame.cdata,cmap,'nodither');
   end
   pause(2)
end
Save the frames as an animated GIF and view the GIF in a browser.
filename = 'wmsanimated.gif';
imwrite(animated,cmap,filename,'DelayTime',1.5, ...
   'LoopCount',inf);
web(filename)
Create Animation of Time-Lapse Radar Observations
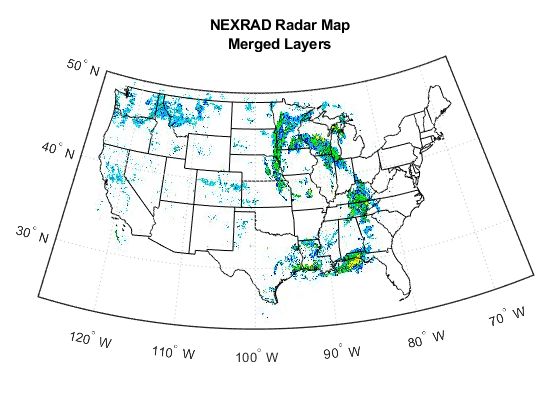
Display Next-Generation Radar (NEXRAD) images for the United States using data from the Iowa Environmental Mesonet (IEM) web map server. The server stores layers covering the past 50 minutes up to the present time in increments of 5 minutes. Read and display the merged layers.
Find layers in the WMS Database that include 'mesonet' and 'nexrad' in their ServerURL fields.
mesonet = wmsfind("mesonet*nexrad",SearchField="serverurl");
NEXRAD Base Reflect Current ("nexrad-n0r") measures the intensity of precipitation. Refine your search to include only layers with this phrase in one of the search fields.
nexrad = refine(mesonet,"nexrad-n0r",SearchField="any");
Remove the 900913 layers because they are intended for Google Maps™ overlay. Remove the WMST layer because it contains data for different times.
layers_900913 = refine(nexrad,"900913",SearchField="layername");
layer_wmst = refine(nexrad,"wmst",SearchField="layername");
rmLayerNames = {layers_900913.LayerName layer_wmst.LayerName};
index = ismember({nexrad.LayerName}, rmLayerNames);
nexrad = nexrad(~index);
Update the nexrad layer to fill in all fields and obtain the most recent data.
nexrad = wmsupdate(nexrad,AllowMultipleServers=true);
Create a map of the conterminous United States. Get the latitude and longitude limits of the map.
figure
usamap("conus")
mstruct = gcm;
latlim = mstruct.maplatlimit;
lonlim = mstruct.maplonlimit;
Read and display the merged layers.
[A,R] = wmsread(nexrad,Latlim=latlim,Lonlim=lonlim);
geoshow(A,R)
geoshow("usastatehi.shp",FaceColor="none")
title("NEXRAD Radar Map","Merged Layers")
Loop through the sequence of time-lapse radar observations. Set the Visible property of the figure to 'off' to hide the figure while populating the frames.
hfig = figure(Visible="off");
usamap("conus")
hstates = geoshow("usastatehi.shp",FaceColor="none");
numFrames = numel(nexrad);
frames = struct("cdata",[],"colormap",[]);
frames(numFrames) = frames;
hmap = [];
frameIndex = 0;
for k = numFrames:-1:1
   frameIndex = frameIndex + 1;
   delete(hmap)
   [A, R] = wmsread(nexrad(k),Latlim=latlim,Lonlim=lonlim);
   hmap = geoshow(A,R);
   uistack(hstates,"top")
   title(nexrad(k).LayerName)
   frames(frameIndex) = getframe(hfig);
end
Create an array to write out as an animated GIF.
animated(1,1,1,numFrames) = 0;
for k=1:numFrames
   if k == 1
      [animated,cmap] = rgb2ind(frames(k).cdata,256,"nodither");
   else
      animated(:,:,1,k) = ...
         rgb2ind(frames(k).cdata,cmap,"nodither");
   end
end
Save the animated GIF and view it in a browser.
filename = "wmsnexrad.gif";
imwrite(animated,cmap,filename,DelayTime=1.5,LoopCount=inf);
web(filename)