geoloc2grid
Convert geolocated data array to regular data grid
Syntax
[Z,R] = geoloc2grid(lat,lon,A,cellsize)
Description
[Z,R] = geoloc2grid(lat,lon,A,cellsize) converts the
geolocated data array A, given geolocation points in
lat and lon, to produce a regular data grid,
Z, and the corresponding raster reference object
R. cellsize is a scalar that specifies the width and
height of data cells in the regular data grid, using the same angular units as
lat and lon. Data cells in Z
falling outside the area covered by A are set to NaN.
Examples
Load a geolocated data array into the workspace.
load("mapmtx.mat","lt1","lg1","map1")
Convert the geolocated data array to a regular data grid with 0.5-degree cells.
cellsize = 0.5;
[Z,R] = geoloc2grid(lt1,lg1,map1,cellsize);
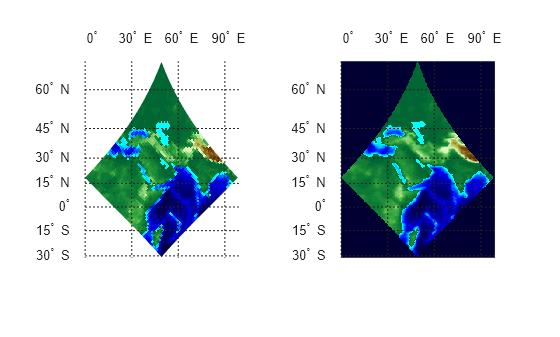
Display the geolocated data array and the regular data grid in a tiled chart layout.
latlim = R.LatitudeLimits;
lonlim = R.LongitudeLimits;

figure
tiledlayout(1,2)

nexttile
ax1 = axesm("mercator",MapLatLimit=latlim,MapLonLimit=lonlim, ...
    Grid="on",MeridianLabel="on",ParallelLabel="on");
ax1.Visible = "off";
geoshow(lt1,lg1,map1,DisplayType="texturemap")
demcmap(map1)
title("Geolocated Data Array")

nexttile
ax2 = axesm("mercator",MapLatLimit=latlim,MapLonLimit=lonlim, ...
    Grid="on",MeridianLabel="on",ParallelLabel="on");
ax2.Visible = "off";
geoshow(Z,R,DisplayType="texturemap")
demcmap(Z)
title("Regular Data Grid")
Tips
geoloc2grid provides an easy-to-use alternative
to gridding geolocated data arrays with imbedm.
There is no need to preallocate the output map; there are no data
gaps in the output (even if cellsize is chosen
to be very small), and the output map is smoother.