Display Image in Polar Coordinates
This example shows how to display an image in polar coordinates by converting the pixel coordinates to angle and radius values. The pixel brightness values are interpolated to create new pixels that align with the polar coordinates.
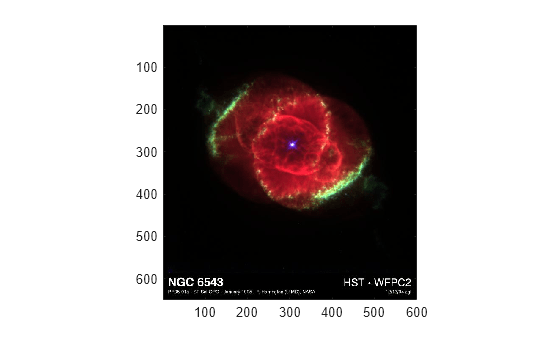
Read the ngc6543a.jpg image and display it.
figure
ax = axes;
Img = imread("ngc6543a.jpg");
imagesc(Img)
axis(ax,"image")
Create a second figure in a dark theme with a polar axes object.
Then create a grid of theta and rho values. Use them to plot a flat surface in polar coordinates by calling the surf function and specifying the polar axes object as the first argument. Specifying the polar axes object ensures that the surface appears in the appropriate axes. (If no axes object exists, surf plots into a Cartesian axes object.)
figure(Theme="dark")
pax = polaraxes;
[theta,rho] = meshgrid(linspace(0,2*pi,50),linspace(0,1,50));
Z = zeros(50,50);
s = surf(pax,-theta,rho,Z);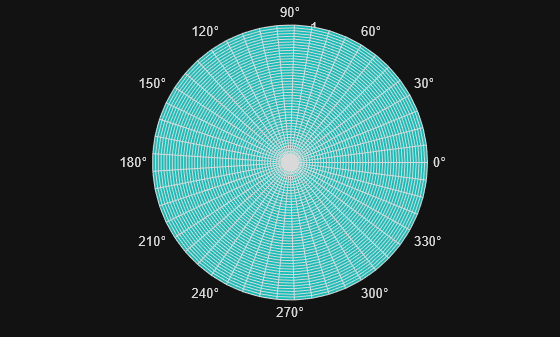
Next, convert the image to a double array and determine the image size. Use the size information to find the center of the image and the radius of the largest circle that fits inside the image rectangle. This circle defines the region of the image to be displayed in the polar axes. Image content outside of this circle is excluded from the final image.
Img = im2double(Img);
[rows,cols,~] = size(Img);
centerX = cols/2;
centerY = rows/2;
minRadius = min(centerX,centerY);
Define T and R as a polar grid for converting the pixel locations in the image to angle and radius values that are appropriate for plotting in polar coordinates.
theta = linspace(0,2*pi,cols);
radius = linspace(0,minRadius,rows);
[T,R] = meshgrid(theta,radius);
Calculate Xim and Yim as the Cartesian-equivalent values of the polar grid points using the pol2cart function. Because Xim and Yim contain fractional values, located between the original pixels, you have to calculate the approximate pixel brightness values at those fractional locations using the interp2 function. Then, assemble the interpolated image, polarImage, as a 3-D array containing the red, green, and blue image channels.
(If your image is a grayscale image or an indexed color image, there is only one channel, so you only need to execute the code in this loop once.)
% Convert polar coordinates to Cartesian coordinates
[Xim,Yim] = pol2cart(T,R);
Xim = Xim + centerX;
Yim = Yim + centerY;

polarImage = uint8(zeros(size(Img)));
% Create new image for polar coordinates
for channel = 1:3
    colorChannel = double(Img(:,:,channel));
    polarChannel = interp2(colorChannel,Xim,Yim,"linear",0);

    % Store the polar channels together in a 3-D array
    polarImage(:,:,channel) = uint8(polarChannel*255);
end
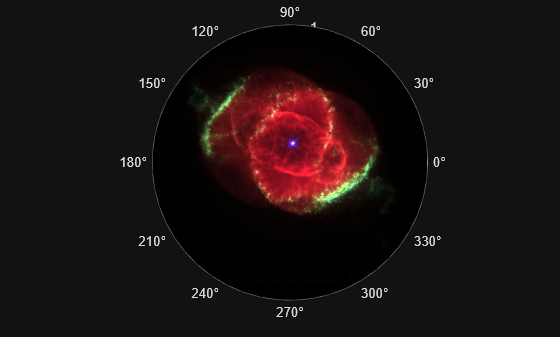
Display the polar image by setting the CData property of the surface to the polarImage array and setting the FaceColor property to "texturemap". Hide the mesh lines by setting the EdgeColor property to "none".
set(s,CData=polarImage,FaceColor="texturemap",EdgeColor="none")
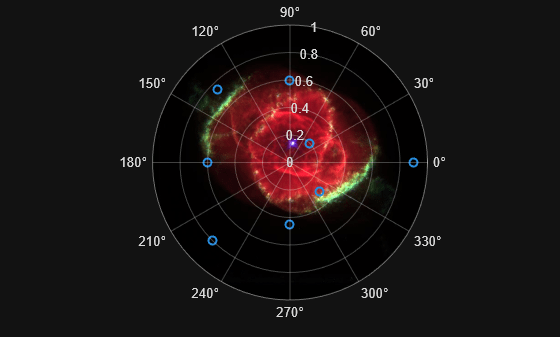
Display a scatter plot on top of the image and display the axes grid lines as the top layer.
hold(pax,"on")
th = pi/4:pi/4:2*pi;
r = [0.2 0.6 0.75 0.6 0.8 0.45 0.3 0.9];
polarscatter(pax,th,r,LineWidth=1.5)
pax.Layer= "top";