The Image Object and Its Properties
Image CData
Note
The image and imagesc commands create
image objects. Image objects are children of axes objects, as are line, patch,
surface, and text objects. Like all graphics objects, the image object has a
number of properties you can set to fine-tune its appearance on the screen. The
most important properties of the image object with respect to appearance are
CData, CDataMapping,
XData, and YData. These properties are
discussed in this and the following sections. For detailed information about
these and all the properties of the image object, see image.
The CData property of an image object contains the data array. In the
following commands, h is the handle of the image object created
by image, and the matrices X and
Y are the same:
h = image(X); colormap(map)
Y = get(h,'CData');
The dimensionality of the CData array controls
whether the image displays using colormap colors or as an RGB image.
If the CData array is two-dimensional, the image
is either an indexed image or an intensity image; in either case,
the image is displayed using colormap colors. If, on the other hand,
the CData array is m-by-n-by-3,
it displays as a truecolor image, ignoring the colormap colors.
Image CDataMapping
The CDataMapping property controls whether an image is
indexed or intensity. To display an
indexed image set the CDataMapping property to
'direct', so that the values of the CData array are used
directly as indices into the figure's colormap. When the image
command is used with a single input argument, it sets the value of
CDataMapping to 'direct':
h = image(X); colormap(map)
get(h,'CDataMapping')
ans =

direct
Intensity images are displayed by setting the CDataMapping property
to 'scaled'. In this case, the CData values
are linearly scaled to form colormap indices. The axes CLim property
controls the scale factors. The imagesc function
creates an image object whose CDataMapping property
is set to 'scaled', and it adjusts the CLim property
of the parent axes. For example:
h = imagesc(I,[0 1]); colormap(map)
get(h,'CDataMapping')
ans =

scaled

get(gca,'CLim')
ans =

[0 1]
XData and YData
The XData and YData properties control
the coordinate system of the image. For an m-by-n image,
the default XData is [1 n] and
the default YData is [1 m].
These settings imply the following:
The left column of the image has an x-coordinate of 1.
The right column of the image has an x-coordinate of n.
The top row of the image has a y-coordinate of 1.
The bottom row of the image has a y-coordinate of m.
Coordinate System for Images
Use Default Coordinate System
Display an image using the default coordinate system. Use colors from the colorcube map.
C = [1 2 3 4; 5 6 7 8; 9 10 11 12];
im = image(C);
colormap(colorcube)
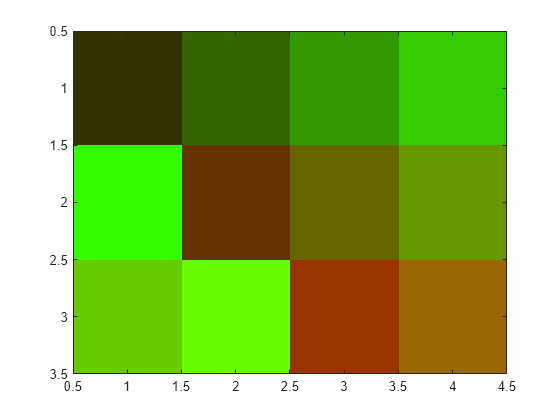
Specify Coordinate System
Display an image and specify the coordinate system. Use colors from the colorcube map.
C = [1 2 3 4; 5 6 7 8; 9 10 11 12];
x = [-1 2];
y = [2 4];
figure
image(x,y,C)
colormap(colorcube)

Add Text to Image Data
This example shows how to use array indexing to rasterize text into an existing image.
Draw the text in an axes using the text function. Then, capture the text from the screen using getframe and close the figure.
fig = figure;
t = text(.05,.1,'Mandrill Face','FontSize',20, ...
    'FontWeight','bold','Color',[0 0 0]);
F = getframe(gca,[10 10 200 200]);
close(fig)
Select any plane of the resulting RGB image returned by getframe. Find the pixels that are black (black is 0) and convert their subscripts to indexes using sub2ind. Use these subscripts to "paint" the text into the image contained in the mandrill MAT-file. Use the size of that image, plus the row and column locations of the text to determine the locations in the new image. Index into new image, replacing pixels.
c = F.cdata(:,:,1);
[i,j] = find(c==0);
load mandrill
ind = sub2ind(size(X),i,j);
X(ind) = uint8(255);
Display the new image using the bone colormap.
imagesc(X)
colormap bone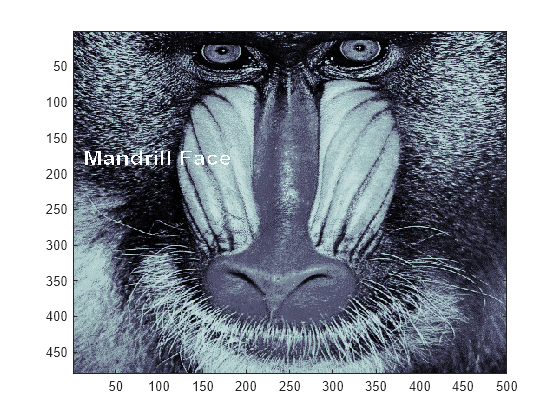
Additional Techniques for Fast Image Updating
To increase the rate at which the CData property of an image
object updates, optimize CData and set some related figure and
axes properties:
Use the smallest data type possible. Using a
uint8data type for your image will be faster than using adoubledata type.Part of the process of setting the image's
CDataproperty includes copying the matrix for the image's use. The overall size of the matrix is dependent on the size of its individual elements. Using smaller individual elements (i.e., a smaller data type) decreases matrix size, and reduces the amount of time needed to copy the matrix.Use the smallest acceptable matrix.
If the speed at which the image is displayed is your highest priority, you may need to compromise on the size and quality of the image. Again, decreasing the size reduces the time needed to copy the matrix.
Set the limit mode properties (
XLimModeandYLimMode) of your axes tomanual.If they are set to
auto, then every time an object (such as an image, line, patch, etc.) changes some aspect of its data, the axes must recalculate its related properties. For example, if you specifyimage(firstimage); set(gca, 'xlimmode','manual',... 'ylimmode','manual',... 'zlimmode','manual',... 'climmode','manual',... 'alimmode','manual');
the axes do not recalculate any of the limit values before redrawing the image.
Consider using a
movieobject if the main point of your task is to simply display a series of images onscreen.The MATLAB®
movieobject utilizes underlying system graphics resources directly, instead of executing MATLAB object code. This is faster than repeatedly setting an image'sCDataproperty, as described earlier.