Uniform Rectangular Array
Support for Uniform Rectangular Arrays
You can implement a uniform rectangular array (URA) with phased.URA.
Array elements are distributed in the yz-plane
with the array look direction along the positive x-axis.
When you use phased.URA, you must specify these aspects
of the array:
Sensor elements of the array
Number of rows and the spacing between them
Number of columns and the spacing between them
Geometry of the planar lattice, which can be rectangular or triangular
Uniform Rectangular Array of Isotropic Antenna Elements
This example shows you how to create a uniform rectangular array (URA) and obtain information about the element positions, the array response, and inter-element time delays. Then, simulate the reception of two sine waves coming from different directions. Both signals have a 1GHz carrier frequency.
Create the URA and obtain the element positions
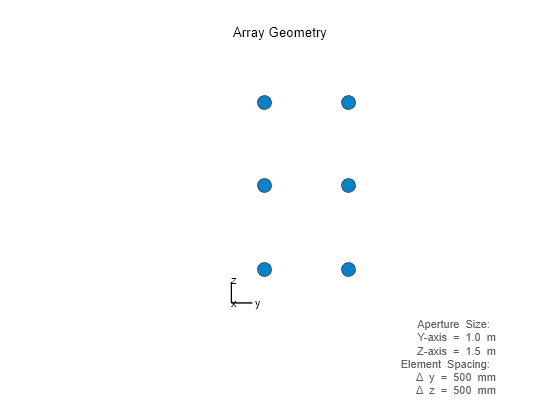
Create and view a six-element URA with two elements along the y-axis and three elements along the z-axis. Use a rectangular lattice, with the default spacing of 0.5 meters along both the row and column dimensions of the array. Each element is an isotropic antenna element, which is the default element type for a URA.
fc = 1e9;
array = phased.URA([3,2]);
viewArray(array)

pos = getElementPosition(array);
The x-coordinate is zero for all elements of the array.
Compute the element delays
Calculate the element delays for signals arriving from +45° and -45° azimuth and 0° elevation.
delay = phased.ElementDelay('SensorArray',array);
ang = [45,-45];
tau = delay(ang);
The first column of tau contains the element delays for the signal incident on the array from +45° azimuth. The second column contains the delays for the signal arriving from -45°. The delays are equal in magnitude but opposite in sign, as expected.
Compute the received signals
The following code simulates the reception of two sinusoidal waves arriving from far field sources. One signal is a 100-Hz sine wave arriving from 20° azimuth and 10° elevation. The second signal is a 300-Hz sine wave arriving from -30° azimuth and 5° elevation.
t = linspace(0,1,1000);
x1 = cos(2*pi*100*t)';
x2 = cos(2*pi*300*t)';
ang1 = [20;10];
ang2 = [-30;5];
recsig = collectPlaneWave(array,[x1 x2],[ang1 ang2],fc);
Each column of recsig represents the received signals at the corresponding element of the URA.
Plot the array response in 3D
You can plot the array response using the pattern method.
pattern(array,fc,[-180:180],[-90:90],'PropagationSpeed',physconst('LightSpeed'),...
    'CoordinateSystem','rectangular','Type','powerdb')
