Contenido principal

pc2image

R2026b

Convert point cloud to image by projection

Since R2026b

    Description

    im = pc2image(ptCloud,resolution) creates an image, im, by projecting the point cloud ptCloud onto the XY-plane and dividing that plane into square cells whose side length is resolution. Each pixel represents one cell and stores the maximum Z-value (elevation) of the points within that cell. Empty cells have a value of 0.

    im = pc2image(ptCloud,xres,yres) creates an image, im, by projecting the point cloud ptCloud onto the XY-plane and dividing that plane into rectangular cells whose side lengths are xres along the X-axis and yres along the Y-axis. Each pixel represents one cell and stores the maximum Z-value (elevation) of the points within that cell. Empty cells have a value of 0.

    im = pc2image(ptCloud,imageSize) creates an image with the number of rows and columns specified by imageSize. The function projects the point cloud onto the XY plane and divides that plane into cells so the grid spans the XY-extent with the specified number of rows and columns.

    im = pc2image(___,fillProperty) specifies the point cloud property used to fill each pixel in the output image, in addition to any combination of input arguments from previous syntaxes. You cannot specify the fillProperty and customFillFcn arguments in the same function call.

    example

    im = pc2image(___,customFillFcn) specifies a custom function for assigning the value of each pixel in the output image. Use this syntax to compute pixel values with your own function instead of specifying a predefined fill property. You cannot specify the fillProperty and customFillFcn arguments in the same function call.

    example

    [im,indices] = pc2image(___) additionally returns the pixel location in the image for each point in the point cloud.

    [im,indices,spatialRef2D] = pc2image(___) additionally returns a 2-D spatial reference object. Use of this syntax requires Image Processing Toolbox™.

    Examples

    collapse all

    Create a lasFileReader object and read point cloud data from a LAZ file.

    lasReader = lasFileReader("aerialScene.laz");
    ptCloud = readPointCloud(lasReader);

    Visualize the point cloud.

    figure
    pcshow(ptCloud)
    title("Input Point Cloud")
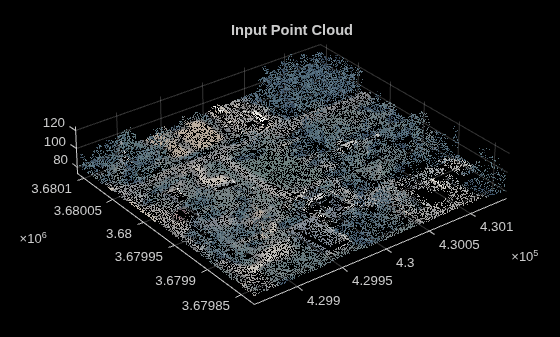
    Figure contains an axes object. The axes object with title Input Point Cloud contains an object of type scatter.

    Specify the XY-plane resolution and create a color image from the top surface of the point cloud.

    resolution = 0.9;
    img = pc2image(ptCloud,resolution,"MaxElevationColor");

    Visualize the output image.

    figure
    imshow(img)
    title("Output Image")
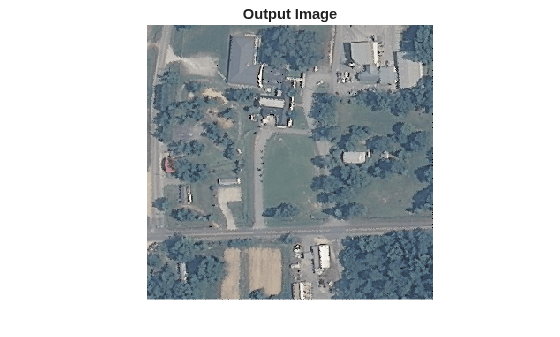
    Figure contains an axes object. The hidden axes object with title Output Image contains an object of type image.

    Create a lasFileReader object and read point cloud data from a LAZ file.

    lasReader = lasFileReader("aerialScene.laz");
    ptCloud = readPointCloud(lasReader);

    Visualize the point cloud.

    figure
    pcshow(ptCloud)
    title("Input Point Cloud")
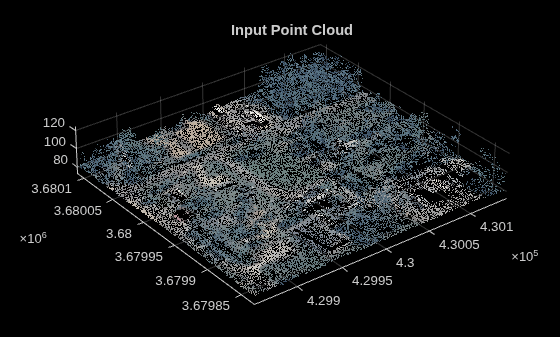
    Figure contains an axes object. The axes object with title Input Point Cloud contains an object of type scatter.

    Specify the XY-plane resolution and create an image using a custom fill function. The function computes the standard deviation of Z-coordinates of points projected into each cell. Standard deviation measures the spread of elevation values in a cell and highlights areas with larger local elevation variation.

    resolution = 0.9;
    customFillFcn = @(S) localElevationStd(S);
    img = pc2image(ptCloud,resolution,customFillFcn);

    Visualize the output image using the parula colormap. Darker colors indicate regions with low elevation variation, such as flat ground or roads. Brighter colors indicate regions with higher elevation variation, such as vegetation.

    figure
    imagesc(img)
    axis image
    colormap(parula)
    colorbar
    title("Output Image")
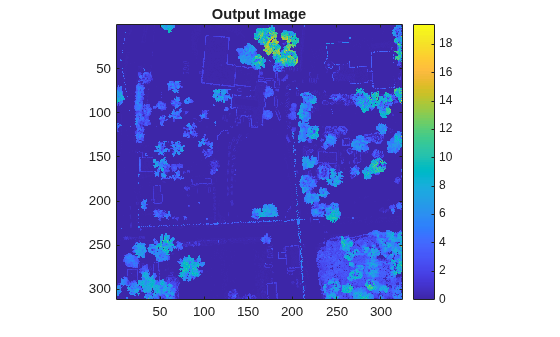
    Figure contains an axes object. The axes object with title Output Image contains an object of type image.

    Define a custom fill function that computes the standard deviation of elevation values for points in a single projected cell.

    function out = localElevationStd(S)
    
    z = S.Location(:,3);
    if numel(z) < 2
        out = 0;
    else
        out = std(z);
    end
    
    end

    Input Arguments

    collapse all

    Point cloud, specified as a pointCloud object.

    Resolution on the XY-plane, specified as a positive scalar. This value sets the pixel size along both the X-axis and Y-axis when projecting the point cloud onto the XY-plane. Units are the same as the units of the input point cloud.

    Data Types: double

    Resolution along the X-axis of the input point cloud, specified as a positive scalar. This value sets the pixel size along the X-axis when projecting the point cloud onto the XY-plane. Units are the same as the units of the input point cloud.

    Data Types: double

    Resolution along the Y-axis of the input point cloud, specified as a positive scalar. This value sets the pixel size along the Y-axis when projecting the point cloud onto the XY-plane. Units are the same as the units of the input point cloud.

    Data Types: double

    Output image size, specified as a two-element vector of the form [numRows numCols]. Each element must be a positive integer. The function projects the point cloud onto the XY-plane and divides that plane into cells so the grid spans the XY-extent with the specified number of rows and columns.

    Data Types: double

    Point cloud property for computing the pixel values in the output image, specified as one of these options:

    • "MaxElevation" — Fills each pixel with the maximum Z-value (elevation) of the points within the corresponding cell.

    • "MaxIntensity" — Fills each pixel with the maximum intensity of the points within the corresponding cell. To specify this option, you must use a point cloud that contains intensity values.

    • "MaxElevationColor" — Fills each pixel with the RGB color of the point that has the maximum intensity within the corresponding cell. To specify this option, you must use a point cloud that contains color values.

    • "MaxElevationIntensity" — Fills each pixel with the intensity of the point that has the maximum elevation within the corresponding cell. To specify this option, you must use a point cloud that contains intensity values.

    • "PointCount" — Fills each pixel with the number of points inside the corresponding cell.

    Data Types: char | string

    Custom function for computing the pixel values, specified as a function handle. For more information, see Create Function Handle. The function must accept first input that consists of a structure with these fields:

    • Location — K-by-3 matrix in which each row specifies the xyz-coordinates of point.

    • Color — K-by-3 matrix in which each row specifies an RGB triplet.

    • Normal — K-by-3 matrix in which each row specifies a normal vector.

    • Intensity — K-by-1 vector of intensity values.

    • PointIndices — K-by-1 vector of indices of points in the input point cloud.

    K is the number of points within a cell.

    To pass additional arguments, specify customFillFcn as an anonymous function. For more information, see Anonymous Functions.

    The function must return a scalar value for single-channel output or a vector for multi-channel output.

    Data Types: function_handle

    Output Arguments

    collapse all

    Output image, returned as an M-by-N matrix or M-by-N-by-C array. M and N are the number of rows and columns in the image. C is the number of channels in the image.

    • If you specify fillProperty as "MaxElevation", "MaxIntensity", "MaxElevationIntensity", or "PointCount", then the output image is an M-by-N matrix.

    • If you specify fillProperty as "MaxElevationColor", then the output image is an M-by-N-by-3 array.

    • If you specify customFillFcn and it returns a scalar, then the output image is an M-by-N matrix. If the customFillFcn returns a C-element vector, then the output image is an M-by-N-by-C array.

    Pixel index for each point, returned as P-by-1 vector or P-by-Q matrix. Each value indicates the pixel location for the point at the corresponding index after projecting the point cloud onto the XY-plane.

    • P-by-1 vector — Returned if ptCloud is an unorganized point cloud. P is the number of points in ptCloud.

    • P-by-Q matrix — Returned if ptCloud is an organized point cloud. P×Q is the total number of points in ptCloud.

    Two-dimensional spatial reference for the output image, returned as an imref2d (Image Processing Toolbox) object, which defines the mapping between the world coordinates (X, Y) and the intrinsic coordinates anchored to the rows and columns of the image. Use of this argument requires Image Processing Toolbox.

    Version History

    Introduced in R2026b

    See Also

    | | (Image Processing Toolbox)