Extract Spectral Features
Interactively extract spectral fault band metrics in the Live Editor
Description
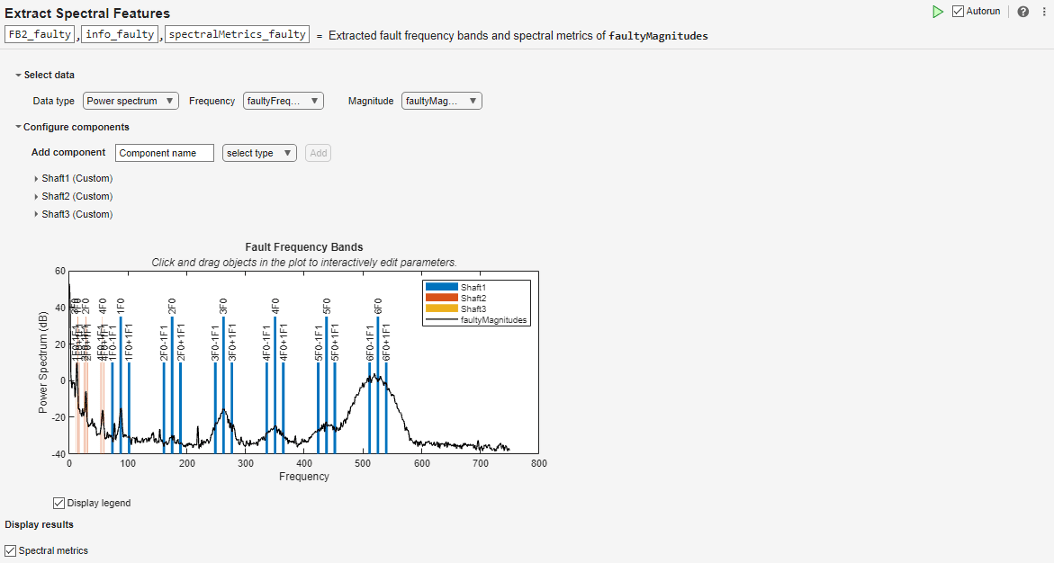
The Extract Spectral Features task lets you interactively extract spectral fault band metrics. The task helps with analyzing and understanding spectral data. Using a comprehensive interface, you can add components to represent various bearings, gear meshes, or other parts of your hardware setup.
As you set the physical parameters of these components, the Extract Spectral Features Live Editor task plots fault frequency bands at the characteristic frequencies of the components. You can overlay power spectrum data on the fault band plot to associate various peaks in the data with the components' characteristic frequencies. These correlations can make fault detection and fault isolation easier, as changes in the power spectrum data can easily be traced back to the physical components causing them. You can also have the task determine the harmonics and sidebands automatically.
In addition to a plot of the characteristic frequencies and the power spectrum data, the task generates spectral metrics of the data within each characteristic frequency band. The output metrics table, which contains the peak amplitude, peak frequency, and band power of each band, aids in characterizing potential mechanical faults. The task automatically generates MATLAB® code for your live script. For more information about Live Editor tasks in general, see Add Interactive Tasks to a Live Script
Open the Task
To add the Extract Spectral Features task to a live script in the MATLAB Editor:
On the Live Editor tab, select Task > Extract Spectral Features.
In a code block in your script, type a relevant keyword, such as
fault bandsormetrics. SelectExtract Spectral Featuresfrom the suggested command completions.
Examples
Use Extract Spectral Features to automatically identify the harmonics and sidebands of an imported signal.
Load the data TVel. Tvel is a timetable that contains the combined vibration signal for a machine.
load velocity_data TVel
Specify Time-Domain for Data Type and import Tvel.

The task computes and plots the power spectrum.

The task allows you to add individual components that represents machine components such as shafts. In this case, the TVel signal combines the vibration data of all components. Add a single custom component that represents the machine.

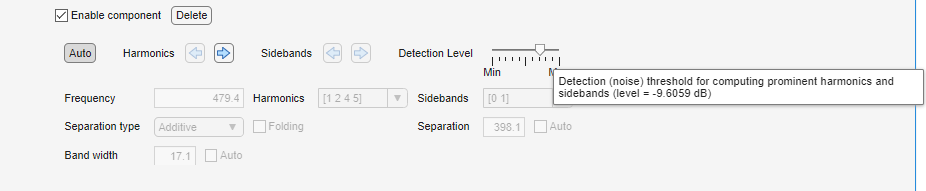
You can manually specify information about the frequency, harmonics, and sidebands. You can also click Auto to have the task compute the values automatically.

The plot shows the harmonics and sidebands, but they are not well grouped with respect to the major peaks.

The detection level, indicated for this component by the blue line, is at around -25 dB. Use the Detection Level slider to move the level to around -10 dB. Alternatively, you can click the blue line in the plot and move it up by dragging.
The band grouping improves somewhat relative to the major peaks.

Cycle through the harmonics by clicking the right arrow in the component section.

This set of frequency bands clearly align with most of the major peaks, but exclude the lower frequency peaks.
Add a new component to capture the fault bands in the lower frequency region. Select Auto and increase the detection level.

Cycle through the harmonics in the new component to find the low frequency harmonics.

The task displays the spectral metrics.

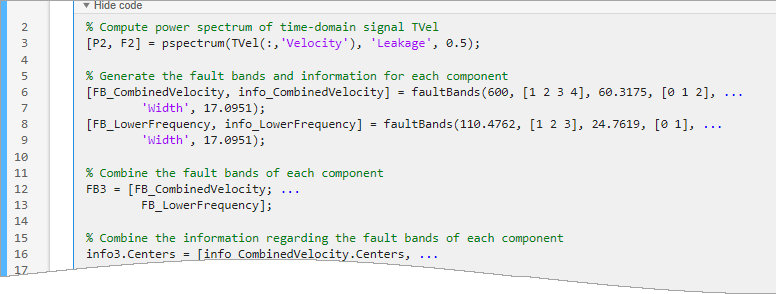
Click Show Code to display the generated code.
Related Examples
Parameters
Version History
Introduced in R2021aSee Also
faultBands | gearMeshFaultBands | bearingFaultBands | faultBandMetrics