slewrate
Slew rate of bilevel waveform
Syntax
Description
s = slewrate(x)x. To determine the transitions, the
slewrate function estimates the state levels of the input
waveform by a histogram method and identifies all regions that cross the upper-state
boundary of the low state and the lower-state boundary of the high state.
[
returns the time instants when the waveform crosses the lower-percent reference
level s,lt,ut]
= slewrate(___)lt and upper-percent reference level
ut. If you do not specify lower- and upper-percent
reference levels, the levels default to 10% and 90%, respectively. You can specify
an input combination from any of the previous syntaxes.
s = slewrate(___,Name,Value)Name,Value arguments.
slewrate(___) plots the bilevel waveform and
darkens the regions of each transition where the slew rate is computed. The plot
marks the lower- and upper-reference level crossings and associated reference
levels. The plot also indicates the state levels and associated lower and upper
tolerances.
Examples
Use slewrate with no output arguments to plot the slew rate information for a step waveform sampled at 4 MHz.
Load the transitionex.mat file and compute the slew rate. Annotate the slew rate in a plot of the waveform.
load('transitionex.mat','x','t')

slewrate(x,t)
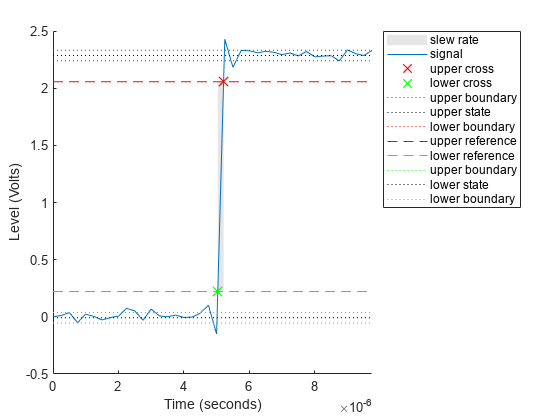
ans =
1.0310e+07
Create a bilevel waveform with three transitions, two positive and one negative. The sample rate is 4 MHz. Obtain the slew rates for the three transitions.
load('transitionex.mat','x')
fs = 4e6;

y = [x;fliplr(x)];
t = (0:length(y)-1)/4e6;

S = slewrate(y,t)
S = 3×1
107 ×

    1.0310
   -0.9320
    1.0310
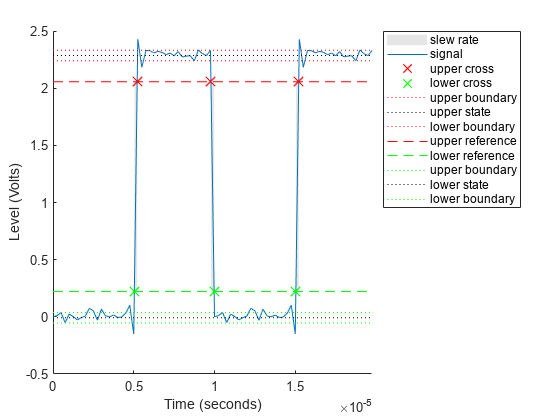
Annotate the result on a plot of the waveform.
slewrate(y,t);

Return the lower- and upper-transition times for a three-transition waveform sampled at 4 MHz.
load('transitionex.mat','x')
fs = 4e6;

y = [x;fliplr(x)];
t = (0:length(y)-1)/fs;

[~,LT,UT] = slewrate(y,t)
LT = 3×1
10-4 ×

    0.0504
    0.0998
    0.1504
UT = 3×1
10-4 ×

    0.0521
    0.0978
    0.1521
Repeat using the sample rate instead of the time vector.
[~,LT,UT] = slewrate(y,fs)
LT = 3×1
10-4 ×

    0.0504
    0.0998
    0.1504
UT = 3×1
10-4 ×

    0.0521
    0.0978
    0.1521
Annotate the result on a plot of the waveform.
slewrate(y,fs);
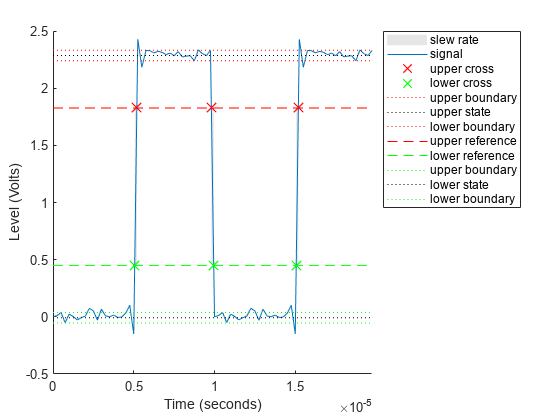
Return the waveform values corresponding to the lower- and upper-reference levels for a three-transition waveform sampled at 4 MHz. Compute these values for 10% and 90%, the default levels.
load("transitionex.mat","x")
fs = 4e6;

y = [x;fliplr(x)];
t = (0:length(y)-1)/fs;

[~,~,~,LL,UL] = slewrate(y,t)
LL =
0.2212
UL =
2.0564
Repeat the calculation for 20% and 80%. Annotate the result on a plot of the waveform
slewrate(y,t,PercentReferenceLevels=[20 80]);
Input Arguments
Name-Value Arguments
Output Arguments
More About
You can specify lower- and upper-state boundaries for each state level. Define the boundaries as the state level plus or minus a scalar multiple of the difference between the high state and the low state. To provide a useful tolerance region, specify the scalar as a small number such as 2/100 or 3/100. In general, the region for the low state is defined as
where is the low-state level and is the high-state level. Replace the first term in the equation with to obtain the tolerance region for the high state.
This figure shows lower and upper 5% state boundaries (tolerance regions) for a positive-polarity bi-level waveform. The thick dashed lines indicate the estimated state levels.

References
[1] IEEE® Standard on Transitions, Pulses, and Related Waveforms, IEEE Standard 181, 2003.
Extended Capabilities
Version History
Introduced in R2012a
See Also
falltime | midcross | pulsewidth | risetime | settlingtime | statelevels