Phase Response
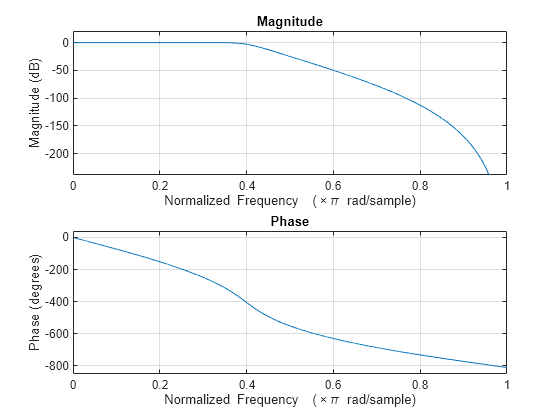
MATLAB® functions are available to extract the phase response of a filter. Given a frequency response, the function abs returns the magnitude and angle returns the phase angle in radians. To view the magnitude and phase of a Butterworth filter:
d = designfilt("lowpassiir",FilterOrder=9, ...
    HalfPowerFrequency=0.4);
freqz(d)
The unwrap function is also useful in frequency analysis. unwrap unwraps the phase to make it continuous across 360° phase discontinuities by adding multiples of ±360°, as needed. To see how unwrap is useful, design a 25th-order lowpass FIR filter:
h = fir1(25,0.4);
Obtain the frequency response with freqz and plot the phase in degrees:
[H,f] = freqz(h,1,512,2);
plot(f,angle(H)*180/pi)
grid
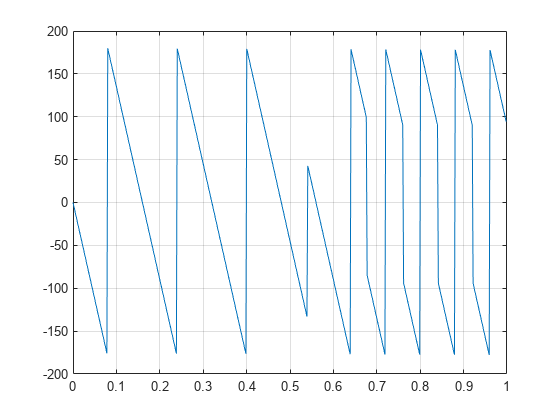
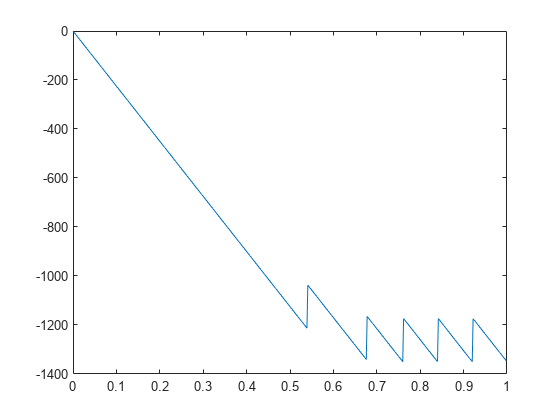
It is difficult to distinguish the 360° jumps (an artifact of the arctangent function inside angle) from the 180° jumps that signify zeros in the frequency response. unwrap eliminates the 360° jumps:
plot(f,unwrap(angle(H))*180/pi)
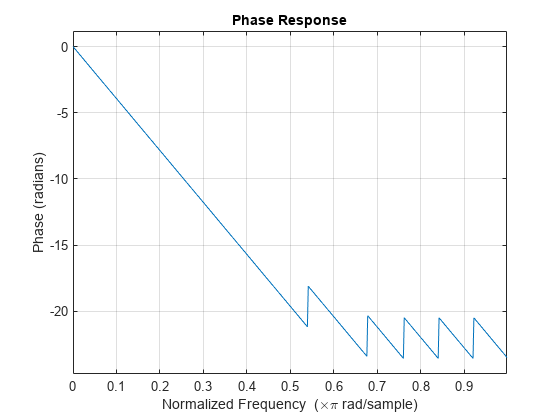
Alternatively, you can use phasez to see the unwrapped phase:
phasez(h,1)