Main Content

Create Dashboard Panel

This example shows how to create a climate control screen for an automotive infotainment system, modeled as a dashboard panel. You can use panels to model and test the user interface of a real system. To model displays and controls on the panel, such as gauges, lamps, knobs, buttons, and switches, you can promote dashboard blocks to the panel. Dashboard blocks are blocks from the Dashboard library, the Customizable Blocks library, and the Aerospace Blockset™ Flight Instruments library.

Video Walkthrough

For a walkthrough of the example, play the video.

In this video, you will learn about dashboard panels by creating a climate control screen for an automotive infotainment system. Before we look at that example, I'd like to provide a brief introduction to dashboard panels for those of you who may not be familiar with them. In Simulink, you can model real-life dashboards like the one in your car. The dashboard can contain controls, like a radio knob or a button for turning on the AC. It can also contain displays, like a speedometer or a check engine light.

To model the controls and displays on the dashboard, use blocks from the dashboard library. The screenshot on the right shows you where in your library browser the dashboard library is located. The dashboard blocks you will see in this video are from the Customizable Blocks library, which is one of the sublibraries in the dashboard library.

As the name suggests, the blocks in the Customizable Blocks library are highly customizable. For example, you can use photos of controls and displays in a real system as the background and foreground images of these blocks. To model the dashboard to which the controls and displays are mounted, use dashboard panels.

A panel floats above the model canvas and follows you through the model hierarchy. You can use panels to monitor signals, tune parameters, and debug from anywhere in the model hierarchy. Now you're ready to do the example and learn how to create, edit, and use dashboard panels.

In the example, you will use dashboard panels to create a climate control screen for an automotive infotainment system from an existing set of dashboard blocks. Open the example by entering this command in the Matlab command window. Then open the SL Demo Climate Control Dashboard Block Simulink model by entering this in the command window.

In the model, navigate into the subsystem named Dashboard Blocks. The subsystem contains a set of dashboard blocks on top of an image annotation. These are the blocks you will use to create the climate control screen.

In this step, you create a new panel and populate it with the dashboard blocks. You can actually take both of these actions simultaneously in the software. The act of creating a new panel and populating it with a selected set of blocks is referred to as promoting blocks to a panel.

Start by selecting the dashboard blocks. Then pause on the ellipsis that appears. In the Action bar that expands, click Promote to Panel. You can only promote dashboard blocks to a panel. Any nondashboard blocks are annotations that you select are ignored when you promote to a panel. This means that you can't promote the image annotation to the panel.

Instead, to give a panel a custom background image, you must edit the panel. In this step, you add the background image to the panel. It's important to know that the imagery sizes to fit the panel. If the panel has a different aspect ratio than the image, the image is distorted. To prevent distortion, the panel must have the same aspect ratio as the background image you add to it.

One way to do this is to add the image to the canvas as an image annotation and then resize the panel to match the size of the image annotation. In this example, the background image has already been added to the canvas as an image annotation, so you just need to resize the panel to match the size of the image annotation. To resize the panel, select the panel, then enter edit mode.

To enter edit mode in the Simulink Toolstrip, on the Panels tab, click Edit Panels. Drag the edges of the panel until they align with the borders of the image annotation in the canvas. To add the background image, in the toolstrip, on the Panels tab, click Add Background. In the Cabin Climate Control Panel folder, select the climatecontrolpanelbackground.png file.

To avoid confusion between the panel background image and the image annotation in the canvas, delete the image annotation. To do so, exit edit mode by clicking Edit Panels. Grab the panel name or any part of the panel where there are no blocks and drag the panel aside so that you can access the annotation. Select the annotation and press Delete.

Suppose that while testing the climate control screen you want to pull up a plot of the cabin temperature without opening extra windows or adding more blocks to the climate control screen. You can do so by adding a tab to the panel and then populating the tab with a dashboard scope block. Then, you can switch between the climate control screen and the plot by clicking the corresponding panel tabs.

In this step, you add a tab to the panel. Select the panel. In the toolstrip on the Panels tab, click Add Tab. If you accidentally create too many tabs, you can delete the extra tabs. Click the tab you want to remove and press Delete. The panel now has two tabs.

In this step, you give the tabs names that reflect their contents. Select the panel. Click the left tab. In the toolstrip on the Panels tab, click Rename Panel. In the Property Inspector Name text box, enter climate control screen. Press Enter. Click the right tab. In the Property Inspector Name text box, enter cabin temp. Press enter.

In this step, you populate the new tab with the cabin temperature plot. Add a dashboard scope block to the model. First, give yourself some room by closing the property inspector. Then, double click the model canvas. In the Quick Insert menu, enter dashboard scope. Press Enter.

Next, promote the dashboard scope block to the panel tab named Cabin Temp. To do so, enter edit mode. Drag the dashboard scope lock onto the panel named Cabin Temp. Increase the size of the block until it fills the panel by dragging the corners outwards. Exit edit mode.

Connect the dashboard scope block on the Cabin Temp tab to the signal the block should display during simulation. To do so, select the dashboard scope block. In the toolstrip on the Scope tab, in the Connect section, click Connect.

Navigate to the top level of the model. Drag the panel to one side of the model window so you can see the right half of the model diagram. Click the signal line that connects to the scope block named thermometer display. The signal is in the lower right of the model diagram.

In the menu that appears, select the checkbox for the signal named Subsystem 1. Click the dashboard scope block. In the toolstrip on the Scope tab, in the Connect section, click Done Connecting. The panel is now complete.

In this step, you use the finished panel to monitor and control values during simulation. Start the simulation. While the simulation is running, try using the controls on the climate control screen. For example, change the desired cabin temperature. Or switch the temperature units to Fahrenheit. To see the effect of the controls on cabin air temperature, click the Cabin Temp tab.

Please note that the climate control system model that the dashboard blocks connect to in this example uses highly simplified heat transfer models and serves here only to demonstrate a type of potential use case for dashboard panels. If, for example, you rapidly change the desired cabin temperature value up and down, the model will deviate significantly from the physical reality. For information about the assumptions in the model, see the simulating automatic climate control system example.

In this step, you learn how to manage panel visibility. Suppose you want to take a closer look at the model in the canvas. To minimize the panel, double click the panel. To restore the panel, double click the panel again.

Suppose you want to view only the panel. You can open the panel in a new window. Select the panel. Pause on the ellipsis that appears above the panel. In the action bar that appears, click Open a New Window. You can run the model from the toolbar at the top of the new window. To return the panel to the canvas, in the toolbar of the Panel window, click Open in Canvas.

You can also dock the panel to the model window. To do so, select the panel. Pause on the ellipsis that appears above the panel. In the action bar that appears, click To return the panel to the canvas, click Open in Canvas.

For more information about creating dashboard panels, editing panels, and managing panel visibility, in the online Simulink documentation, see Getting Started with Panels. For examples of how to create the type of customized dashboard blocks you saw in the example today, in the online Simulink documentation, see the Customizable Blocks library help page.

Video Player is loading.
Current Time 0:00
Duration 0:00
Loaded: 0%
Stream Type LIVE
Remaining Time 0:00
 
1x
  • Chapters
  • descriptions off, selected
  • captions off, selected

      Create Dashboard Panel for Climate Control System

      In this example, you promote a set of blocks to a panel. You add a tab to the panel and populate the tab. Then, you use the panel to monitor and control values in the climate control system during simulation. Note that the climate control system model uses highly simplified heat transfer models and serves here only to demonstrate a type of potential use case for panels. For information about the assumptions in the model, see Simulating Automatic Climate Control Systems.

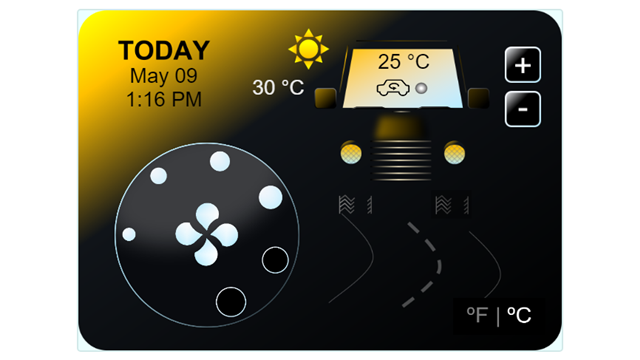
      The climate control screen you create has these controls:

      • A dial for fan speed, modeled using a Slider Switch block

      • A button to turn air recirculation in the cabin on and off, modeled using a Push Button block

      • Two buttons for increasing or decreasing desired cabin temperature, modeled using Callback Button blocks

      • A button for switching temperature units between Celsius and Fahrenheit, modeled using a Callback Button block

      The climate control screen has these displays:

      • Cabin temperature, modeled using a Display block

      • Outside temperature, modeled using a Display block

      • Current date and time, modeled using a Display block

      • A picture of the sun or moon to indicate time of day, modeled using a Lamp block

      For examples on how to customize blocks from the Customizable Blocks library to look like controls and displays in real systems, see Control Simulations with Interactive Dashboards.

      To try out the finished panel without working through this example, open the sldemo_climate_control_panel.slx model by entering this command in the MATLAB® Command Window:

      open_system('sldemo_climate_control_panel.slx')

      Promote Blocks to Panel

      When you open this example, the sldemo_climate_control_dashboard_blocks.slx model opens and shows the Dashboard Blocks subsystem. The subsystem contains a set of blocks from the Dashboard and Customizable Blocks libraries.

      The blocks are on top of an image annotation. The image annotation is the same image as the background image for the panel.

      Unlike the blocks, you cannot promote the image to a panel. Promote the blocks to a panel, then add the background image to the panel. To promote the blocks to a panel, marquee select all the blocks on top of the image. Where you release your cursor, an ellipsis (...) appears.

      Pause on the ellipsis. In the action menu that expands, click Promote to Panel.

      A message appears in the Simulink Editor to remind you that only dashboard blocks can be promoted to a panel. The message appears because the image annotation is not promoted to the panel.

      Add Panel Background Image

      When you add a background image to a panel, the image resizes to fit the panel. If the panel has a different aspect ratio than the image, the image is distorted.

      Before you add the background image to the panel, resize the panel to be the same size as the background image. To resize the panel:

      1. Select the panel.

      2. To enter panel edit mode, in the Simulink® Toolstrip, on the Panels tab, in the Edit section, click Edit Panels.

      3. Drag the edges of the panel until they align with the borders of the image annotation in the canvas.

      The last step shows how you can use image annotations to guide the process of resizing the panel. For information about how to add image annotations to the canvas, see Create Image Annotations.

      Now, add the background image. In the toolstrip, on the Panels tab, in the Edit section, click Add Background. In the CabinClimateControlPanel folder, select the climate-control-panel-background.png file.

      Remove the image annotation in the canvas:

      1. To exit panel edit mode, click anywhere in the canvas.

      2. To access the image annotation, grab the panel name or any part of the panel where there are no blocks and drag the panel aside so that you can see the image annotation.

      3. Select the image annotation in the canvas.

      4. Press Delete.

      Add Tabs to Panel

      Suppose that while testing the climate control screen, you want to pull up a plot of the cabin temperature without opening extra windows or adding more blocks to the climate control screen. You can do so by adding a tab to the panel and populating the tab with a Dashboard Scope block. Then, you can switch between the climate control screen and the plot by clicking the corresponding panel tabs.

      To add a tab to the panel, in the toolstrip, on the Panels tab, in the Edit section, click Add Tab.

      If you accidentally create too many tabs, you can delete the extra tabs. Click the tab you want to remove and press Delete.

      Rename Tabs

      The panel now has two tabs. Give the tabs names that reflect their contents:

      1. Click the left tab.

      2. In the toolstrip, on the Panels tab, in the Edit section, click Rename Panel.

      3. In the Property Inspector Name text box, enter Climate Control Screen.

      4. Click the right tab.

      5. In the Property Inspector Name text box, enter Cabin Temp.

      Populate Tabs

      To create the plot, exit panel edit mode by clicking anywhere on the canvas.

      To add a Dashboard Scope block to the model, double-click the canvas. In the Quick Insert menu, type dashboard scope. If needed, use your arrow keys to select the entry for the Dashboard Scope block, then press Enter.

      To promote the Dashboard Scope block to the panel tab named Cabin Temp, enter panel edit mode. To enter panel edit mode, select the panel. Then, in the toolstrip, on the Panels tab, in the Edit section, click Edit Panel.

      Drag the Dashboard Scope block onto the panel tab named Cabin Temp.

      Increase the size of the block until it fills the panel by dragging the corners outwards.

      Exit panel edit mode by clicking anywhere in the canvas.

      Connect the Dashboard Scope block on the Cabin Temp tab to the signal the block should display during simulation.

      1. Select the Dashboard Scope block.

      2. In the Simulink Toolstrip, on the Scope tab, in the Connect section, click Connect.

      3. Navigate to the top level of the model.

      4. Drag the panel to one side of the model window so you can see the right half of the model diagram.

      5. Click the signal line that connects to the Scope block named Thermometer Display. The signal is in the lower right of the model diagram.

      6. In the menu that appears, select the check box for the signal named Subsystem:1.

      7. Click the Dashboard Scope block.

      8. In the Simulink Toolstrip, on the Scope tab, in the Connect section, click Done Connecting.

      The panel is complete.

      Monitor and Display Values During Simulation Using Panel

      To run the simulation, in the Simulink toolstrip, on the Simulation tab, in the Simulate section, click Run.

      While the simulation is running, try using the controls on the climate control screen.

      1. To set the fan speed to the second-to-highest setting, on the fan speed dial, click the second largest circle.

      2. To change the desired cabin temperature to 20 degrees Celsius, click the plus button in the upper right corner of the panel five times.

      3. To activate air recirculation in the cabin, click the cabin air recirculation button on the car windscreen in the panel.

      4. To see all the temperatures on the climate control screen in degrees Fahrenheit, click the temperature units button in the lower left corner of the panel.

      To see the effect of the controls on the cabin air temperature, after changing a control setting, click the Cabin Temp tab.

      Manage Panel Visibility

      Suppose you want to take a closer look at the model in the canvas. To minimize the panel, double-click the panel. To restore the panel, double-click the panel.

      Suppose you want to view only the panel. You can open the panel in a new window, then minimize the model window. You can run and stop the simulation from the panel window, and you can operate the controls in the panel.

      1. Select the panel.

      2. In the toolstrip, in the Panels tab, in the Manage section, click Pop Out Panel.

      3. Minimize the model window.

      4. To run the simulation, click the Run button at the top of the panel window.

      5. On the Climate Control Screen tab, change the setting of one of the controls. For example, click the minus button in the upper right to decrease the desired cabin temperature.

      6. To stop the simulation, click the Stop button at the top of the panel window.

      Learn More About Panels

      For more information about creating panels, editing panels, and managing panel visibility, see Getting Started with Panels.

      See Also

      Topics