Spectrum Analyzer Distortion Measurements Panel
The Distortion Measurements panel displays harmonic distortion and intermodulation distortion measurements.
From the menu, select Tools > Measurements > Distortion Measurements.
On the toolbar, click the Distortion Measurements
 button.
The Distortion Measurements panel has an expandable Harmonics pane, which shows measurement results for the specified number of harmonics.
Note
For an accurate measurement, ensure that the fundamental signal (for harmonics) or primary tones (for
intermodulation) is larger than any spurious or harmonic content. To do so, you may need to adjust the
resolution bandwidth (RBW) of the spectrum analyzer. Make sure that the bandwidth is
low enough to isolate the signal and harmonics from spurious and noise content. In general, you should set
the RBW so that there is at least a 10dB separation between the peaks of the sinusoids and the noise
floor. You may also need to select a different spectral window to obtain a valid measurement.
Distortion — The type of distortion measurements to display. Available options are
HarmonicorIntermodulation. SelectHarmonicif your system input is a single sinusoid. SelectIntermodulationif your system input is two equal amplitude sinusoids. Intermodulation can help you determine distortion when only a small portion of the available bandwidth will be used.
When you select Harmonic as the Distortion, the
following fields appear.
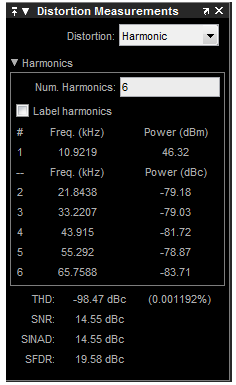
The harmonic distortion measurement automatically locates the largest sinusoidal component (fundamental signal frequency). It then computes the harmonic frequencies and power in each harmonic in your signal. Any DC component is ignored. Any harmonics that are outside the spectrum analyzer’s frequency span are not included in the measurements. Adjust your frequency span so that it includes all the desired harmonics.
Note
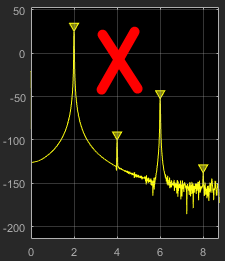
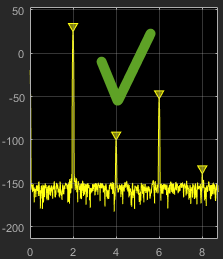
To view the best harmonics, make sure that your fundamental frequency is set high enough to resolve the harmonics. However, this frequency should not be so high that aliasing occurs. For the best display of harmonic distortion, your plot should not show skirts, which indicate frequency leakage. Also, the noise floor should be visible.
For a better display, try a Kaiser window with a large sidelobe attenuation (e.g. between 100–300 db).
Num. Harmonics — Number of harmonics to display, including the fundamental frequency. Valid values of Num. Harmonics are from
2to99. The default value is6.Label Harmonics — Select Label Harmonics to add numerical labels to each harmonic in the spectrum display.
1 — The fundamental frequency, in hertz, and its power, in decibels of the measured power referenced to 1 milliwatt (dBm).
2, 3, ... — The harmonics frequencies, in hertz, and their power in decibels relative to the carrier (dBc). If the harmonics are at the same level or exceed the fundamental frequency, reduce the input power.
THD — The total harmonic distortion. This value represents the ratio of the power in the harmonics, D, to the power in the fundamental frequency, S. If the noise power is too high in relation to the harmonics, the THD value is not accurate. In this case, lower the resolution bandwidth or select a different spectral window.
SNR — Signal-to-noise ratio (SNR). This value represents the ratio of power in the fundamental frequency, S, to the power of all nonharmonic content, N, including spurious signals, in decibels relative to the carrier (dBc).
If you see
––as the reported SNR, the total non-harmonic content of your signal is less than 30% of the total signal.SINAD — Signal-to-noise-and-distortion. This value represents the ratio of the power in the fundamental frequency, S to all other content (including noise, N, and harmonic distortion, D), in decibels relative to the carrier (dBc).
SFDR — Spurious free dynamic range (SFDR). This value represents the ratio of the power in the fundamental frequency, S, to power of the largest spurious signal, R, regardless of where it falls in the frequency spectrum. The worst spurious signal may or may not be a harmonic of the original signal. SFDR represents the smallest value of a signal that can be distinguished from a large interfering signal. SFDR includes harmonics.
When you select Intermodulation as the Distortion,
the following fields appear.
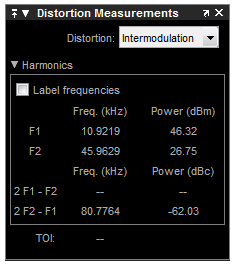
The intermodulation distortion measurement automatically locates the fundamental, first-order frequencies (F1 and F2). It then computes the frequencies of the third-order intermodulation products (2*F1-F2 and 2*F2-F1).
Label frequencies — Select Label frequencies to add numerical labels to the first-order intermodulation product and third-order frequencies in the spectrum analyzer display.
F1 — Lower fundamental first-order frequency
F2 — Upper fundamental first-order frequency
2F1 - F2 — Lower intermodulation product from third-order harmonics
2F2 - F1 — Upper intermodulation product from third-order harmonics
TOI — Third-order intercept point. If the noise power is too high in relation to the harmonics, the TOI value will not be accurate. In this case, you should lower the resolution bandwidth or select a different spectral window. If the TOI has the same amplitude as the input two-tone signal, reduce the power of that input signal.