Assess Requirements-Based Testing Quality by Using the Model Testing Dashboard
You can assess the status of your model testing activities by using the metrics in the Model Testing Dashboard. When you test your models against requirements, you maintain traceability between the requirements, models, tests, and results. The dashboard helps you to track the status of these artifacts and the traceability relationships between them. Each metric in the dashboard measures a different aspect of the quality of the testing artifacts and reflects guidelines in industry-recognized software development standards, such as ISO 26262 and DO-178C. For more information, see Assess Requirements-Based Testing for ISO 26262.
From the dashboard, you can identify and fix testing issues. Update the dashboard metrics to track your progress toward testing compliance.
Open the Project and Model Testing Dashboard
The Model Testing Dashboard shows data on the traceability and testing status for the Units in your project. A unit is a functional entity in your software architecture that you can execute and test independently or as part of larger system tests. You can label models as units in the Model Testing Dashboard. If you do not specify the models that are considered units, then the dashboard considers a model to be a unit if it does not reference other models. By default, the dashboard considers each Simulink® model in your project to represent a unit because you use models to design and test algorithms.
Open the project that contains the models and testing artifacts. For this example, in the MATLAB® Command Window, enter:
openExample('shared_vnv/FixRequirementsBasedTestingIssuesExample')
openProject("cc_CruiseControl");
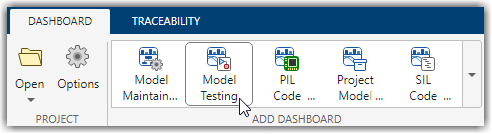
Open the Dashboard window. On the Project tab, click Model Testing Dashboard.
Open the Model Testing Dashboard by clicking Model Testing in the dashboard toolstrip. The dashboard identifies the artifacts in the project, performs an initial traceability analysis, and collects metric results for the metrics available in your installation.
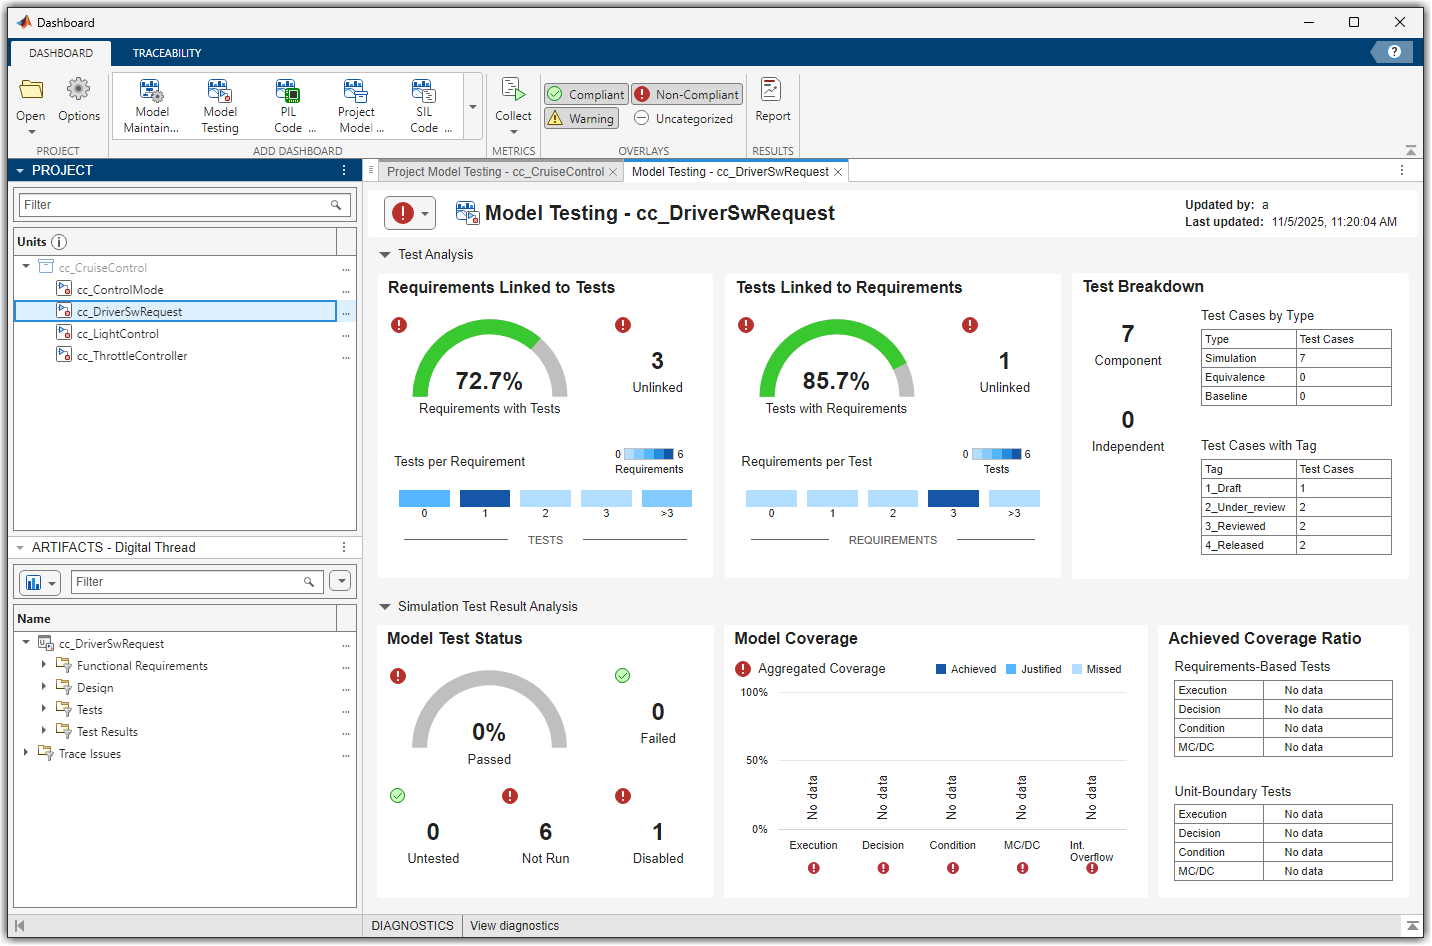
The Project panel shows the architecture of the software units and components in the current project. The Artifacts panel shows the artifacts that the dashboard traced to the currently selected unit or component.
In the Project panel, select the unit cc_DriverSwRequest. The dashboard analyzes the traceability links from artifacts to models and populates widgets with metric results for the selected unit.
Assess Traceability of Artifacts
When the dashboard collects and reports metric data, it scopes the results to the artifacts in one unit in the project. Use the Artifacts panel to view the artifacts that trace to the unit that you selected in the Project panel.
In the Artifacts panel, expand the Functional Requirements section and then expand the Implemented and Upstream sections. This unit implements the requirements in the file
cc_SoftwareReqs.slreqxand links to the upstream, system-level requirements indas_SystemReqs.slreqx.Click the arrow to the left of a file name to see the individual requirements that trace to the model.
To see the artifact type and the path to the artifact, click the three dots next to the artifact name to open a tooltip.
You can explore the sections in the Artifacts panel to see which requirements, tests, and test results trace to each unit in the project. For more information on how the dashboard analyzes this traceability, see Trace Artifacts to Units and Components.
Explore Metric Results for a Unit
In the Test Analysis section of the dashboard, locate the Tests with Requirements widget. To view tooltips with details about the results, point to the sections of the gauge or to the percentage result.

To explore the metric data in more detail, click an individual metric widget. For example, click the Tests with Requirements widget to view the Metric Details section for the metric.
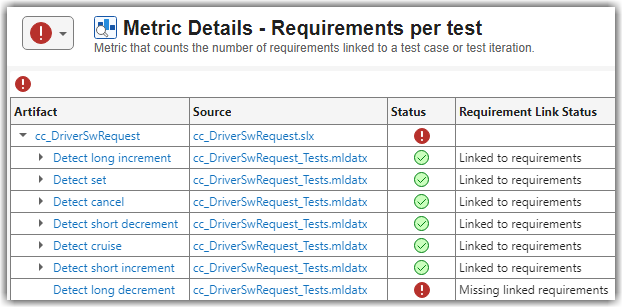
The table shows each test for the unit, the test file containing each test, and whether the test is linked to requirements. The table shows that the test
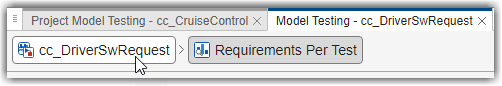
Detect long decrementis missing linked requirements. You can use the Model Testing Dashboard to open the test in the Test Manager by clicking Detect long decrement in the Artifact column.At the top of the Model Testing Dashboard, there is a breadcrumb trail from the Metric Details back to the Model Testing results. Click the breadcrumb button for cc_DriverSwRequest to return to the Model Testing results for the unit.
In the dashboard, you can click the widgets to view the details of their metric results and use the hyperlinks in the tables to open the artifacts and address testing gaps. For more information on using the data in the dashboard, see Explore Status and Quality of Testing Activities Using Model Testing Dashboard.
Track Testing Status of a Project Using the Model Testing Dashboard
To use the Model Testing Dashboard to track your testing activities, set up and maintain your project using the best practices described in Manage Project Artifacts for Analysis in Dashboard. As you develop and test your models, use the dashboard to identify testing gaps, fix the underlying artifacts, and track your progress towards model testing completion. For more information on finding and addressing gaps in your model testing, see Fix Requirements-Based Testing Issues.