Interact with Plots
This topic shows how to interact with plots in the Response Optimizer.
Response Plots
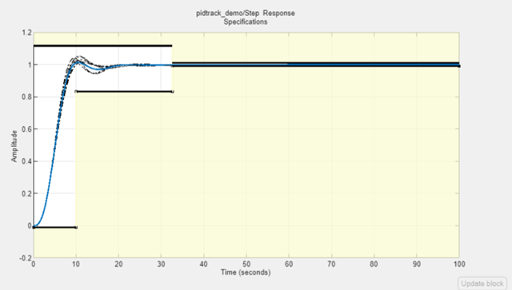
View model signals and the requirements applied to the signal using a response plot. You can also plot the frequency response of a system (requires Simulink® Control Design™ software).
The response plot shows the system response as it varies during optimization. You can also view the uncertain system responses in the plot.

To plot a response plot:
In the Response Optimization tab of the app, in the Data to Plot drop-down list, choose a signal, linear system, or requirement.

Select a response plot in the Add Plot drop-down list.
You can add to an existing plot, or create a plot. The drop-down list has entries for the supported plot types for the given plot variable.
Display the current model response.
Click Plot Model Response. The current response appears as a thick line on the response plot.
Configure the plot display.
To select the signal or systems to display, right-click within the white space in the plot, and choose from Signals and Systems in the menu.
To control whether the response signal displays at intermediate steps during optimization, right-click within the white space in the plot and select Responses > Show Iteration Responses. The response at an intermediate step is based on parameter values at that intermediate step in the optimization.
Modify plot properties.
You can change plot properties such as plot title, axis labels, axes limits, and units. Right-click the white space in a plot and select Axes Properties to open the Property Editor dialog box.
Spider Plots
Compare the values of design variable sets or evaluated requirements using a spider plot.
Spider plots depict multivariate data using a separate axis for each variable. The various axes are arranged clockwise and have a common intersecting point.

To plot a spider plot for a design variable set or evaluated requirements:
In the Response Optimization tab of the app, in Data to Plot, choose design variables, or evaluated requirements.
Select a Spider plot in the Add Plot drop-down list.
You can add to an existing plot, or create a new one. The drop-down list has entries for the supported plot types for the given plot variable.
Configure the plot display.
To view only some of the variables or requirement values in a given plot, right-click the plot, and select the variables or requirements in the Show list.
For information on using a spider plot to compare design variables sets or evaluated requirements, see Compare Requirements and Design Variables Using Spider Plot
Iteration Plots
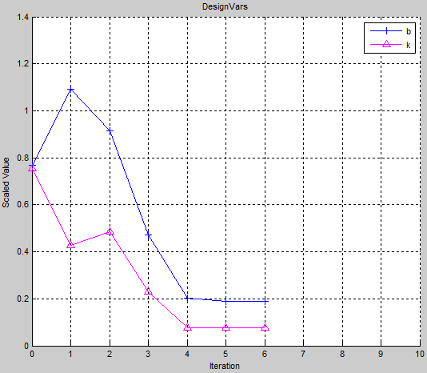
Plot the values of design variables and requirements as they vary during optimization using an iteration plot.
Iteration plots depict the value of the plot variables for each iteration. The x-axis represents the iteration number.

To plot an iteration plot for a design variable set or requirements:
In the Response Optimization tab of the app, in Data to Plot, choose design variables or requirements.
Select an iteration plot in the Add Plot drop-down list.
You can add to an existing plot, or create a plot. The drop-down list has entries for the supported plot types for the given plot variable.
Configure the plot display.
To view scaled values of the plotted variables, right-click the plot, and select Show scaled values.
Save design variables and requirements values for a given iteration using the iteration plots.
For more information, see Save Design Variable Values for Specific Iteration.
Multiobjective Scatter Plots
Visualize the tradeoffs among multiple objectives for pareto-optimal design variables by using a multiobjective scatter plot.
The multiobjective scatter plot shows the objective values for all pareto-optimal outcomes. It is available only when there are two or more objectives. If there are more than two objectives, then the multiobjective scatter plot consists of pairwise scatter plots. Each point in the plot is a design outcome that corresponds to a row in the tradeoff result table. The plot helps you select the design outcome that best solves the tradeoff among the objectives.

To plot a multiobjective scatter plot for a design variable set with at least two objectives:
In the app, on the Response Optimization tab, click Explore tradeoffs. The app displays the multiobjective scatter plot and updates it after each iteration.
After the tradeoff exploration, you can see a result object, TradeoffResult, appears in the Data section of the app. TradeoffResult is a table containing all the pareto-optimal design variables and their objectives.
Configure the plot display.
Click a design outcome to view the design details on the right side of the plot. These details show the values of the design variables and objectives that correspond to the selected design outcome.
To export the variable values for the selected design outcome, on the Multiobjective Scatter Plot tab, click Extract selected outcome. An object containing these variable values appears in the Data section of the app. To export the variable values of all visible outcomes in the plot, on the Multiobjective Scatter Plot tab, click Extract all visible outcomes.
You can also choose to prevent the plot from updating after every iteration and view the plot only after the tradeoff exploration is complete. To do this:
In the app, on the Response Optimization tab, select Options > General.
In the Response Optimization Options dialog box, clear the Update plots during optimization option.
On the Response Optimization tab, click Explore Tradeoffs. The TradeoffResult object appears in the Data section of the app.
In the Data to Plot menu, under
Objective
                                Evaluations
, chooseTradeoffResult.In the Add Plot menu, select
Multiobjective scatter plot.
Parallel Plots
Create a parallel coordinates plot from the tradeoff result table.
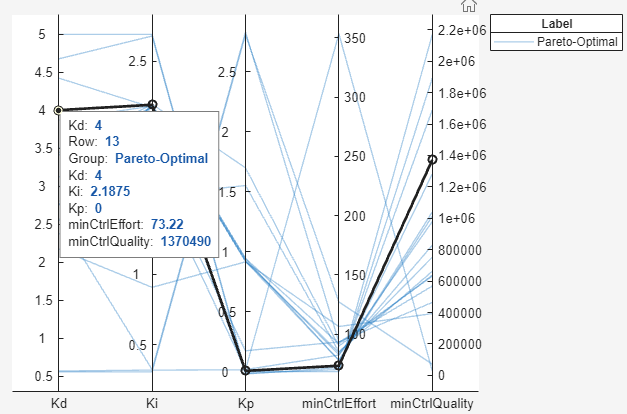
Each line in the parallel plot represents a row in the tradeoff result table. Each coordinate variable in the plot corresponds to a column in the table.

To plot a parallel plot for a design variable set with at least two objectives:
In the app, on the Response Optimization tab, click Explore tradeoffs.
In the Data section of the app, you can now see a result object, TradeoffResult, which is a table containing all the pareto-optimal design variables and their objectives.
On the Response Optimization tab of the app, in the Data to Plot menu, under
Objective Evaluations, chooseTradeoffResult.In the Add Plot menu, select
Parallel plot.Configure the plot display.
Click on a line to view the design details. These details show the values of the design variables, their row number in the result table, and the objectives corresponding to the selected design outcome.
To export the variable values of all visible outcomes in the plot, on the Parallel Plot tab, click Extract all visible outcomes. A new object containing these variable values appears in the Data section of the app.
For more information on parallel coordinates plot, see parallelplot.