Visualize and Play Back MAVLink Flight Log in 3D Scenario
R2026bThis example shows how to load MAVLink telemetry logs (TLOGs) from ArduPilot or PX4 autopilots into MATLAB®, extract GPS and attitude data, and replay flight paths in a 3D scenario with two UAVs.
Load MAVLink TLOGs
Create a mavlinkdialect object using the common.xml dialect. Use the mavlinktlog object to load both flight logs.
dialect = mavlinkdialect("common.xml");
logimport = mavlinktlog("logImport1.tlog",dialect);
logimport2 = mavlinktlog("logImport2.tlog",dialect);
Extract Flight Data
Extract GPS positions and attitude angles from both TLOGs using a local function. The function removes duplicate waypoints to avoid redundant updates during replay.
function [lat,lon,alt,yaw,pitch,roll,waypoints,uniqueIdx,latlon] = extractWaypoints(logData)
    % Read GPS and attitude messages from the first 240 seconds
    msgs = readmsg(logData,MessageName="GPS_RAW_INT",Time=[0 240]);
    latlon = msgs.Messages{1};
    latlon = latlon(latlon.lat ~= 0 & latlon.lon ~= 0,:);
    msgs = readmsg(logData,MessageName="ATTITUDE",Time=[0 240]);
    attitudeData = msgs.Messages{1};

    % Convert integer format to degrees
    lat = double(latlon.lat)/1e7;
    lon = double(latlon.lon)/1e7;
    alt = double(latlon.alt)/1e3;

    % Sync attitude to GPS timestamps and convert to degrees
    [yaw,pitch,roll] = syncAttitudeToGPS(attitudeData,latlon);

    % Remove duplicate waypoints
    waypoints = [lat lon alt];
    [waypoints,uniqueIdx] = unique(waypoints,"rows","stable");
    yaw = yaw(uniqueIdx);
    pitch = pitch(uniqueIdx);
    roll = roll(uniqueIdx);
end

% Extract waypoints for UAV 1
[lat,lon,alt,yaw,pitch,roll,waypoints,uniqueIdx,latlon] = extractWaypoints(logimport);

% Extract waypoints for UAV 2
[lat2,lon2,alt2,yaw2,pitch2,roll2,waypoints2,uniqueIdx2,latlon2] = extractWaypoints(logimport2);
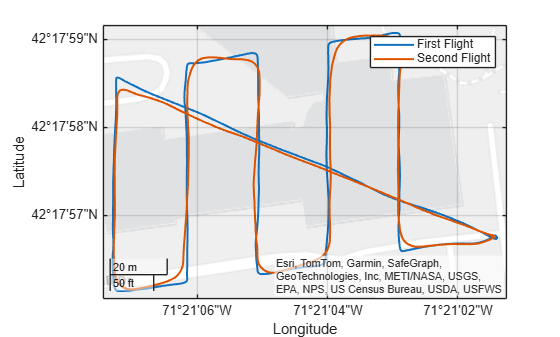
Preview both flight paths on a geographic plot before visualizing them in 3D. Both UAVs follow the same predefined waypoints. Differences in control parameter settings produce slightly different trajectories.
geoplot(lat,lon,LineWidth=1.5)
hold on
geoplot(lat2,lon2,LineWidth=1.5)
legend("First Flight","Second Flight")
Visualize Both Flight Paths in 3D Scenario
Create a 3D scenario and define a North-East-Down (NED) geographic reference frame.
s = scenario();
nedFrame = geoframe(AxesConvention="ned",Terrain=s.Scene.Terrain);
Add one point actor for each UAV at its initial position and orientation. Use the pose function to define the initial position and orientation of each UAV in the NED reference frame. The orientation is specified as a quaternion constructed from Euler angles in degrees ("eulerd"), using a Z-Y-X rotation sequence and a frame (intrinsic) rotation convention.
initialPose = pose(waypoints(1,:),quaternion([yaw(1) pitch(1) roll(1)],"eulerd","ZYX","frame"),ReferenceFrame=nedFrame);
ac1 = actor(s,initialPose,Name="UAV 1");
initialPose2 = pose(waypoints2(1,:),quaternion([yaw2(1) pitch2(1) roll2(1)],"eulerd","ZYX","frame"),ReferenceFrame=nedFrame);
ac2 = actor(s,initialPose2,Name="UAV 2");
Open a scenario viewer.
v = viewer(s);
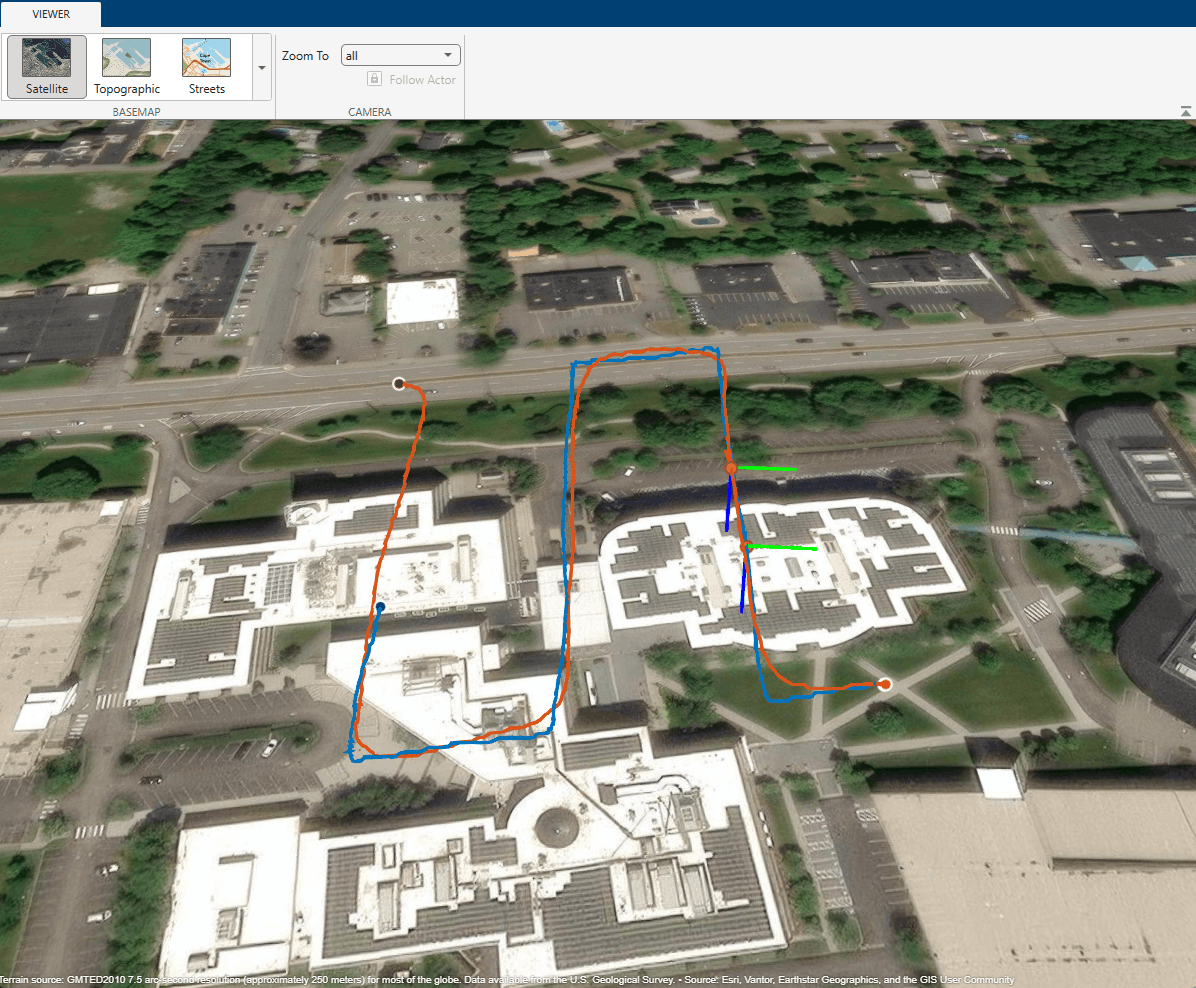
Customize the appearance of each UAV in the viewer. Create FRD (Forward-Right-Down) orientation vectors to visualize the body frame during replay.
vectorScale = 10; % Length of orientation vectors in meters

% UAV 1 FRD vectors
[fwdLine1,rightLine1,downLine1] = createFRDVectors(v,waypoints(1,1),waypoints(1,2),waypoints(1,3));

% UAV 2 FRD vectors
[fwdLine2,rightLine2,downLine2] = createFRDVectors(v,waypoints2(1,1),waypoints2(1,2),waypoints2(1,3));
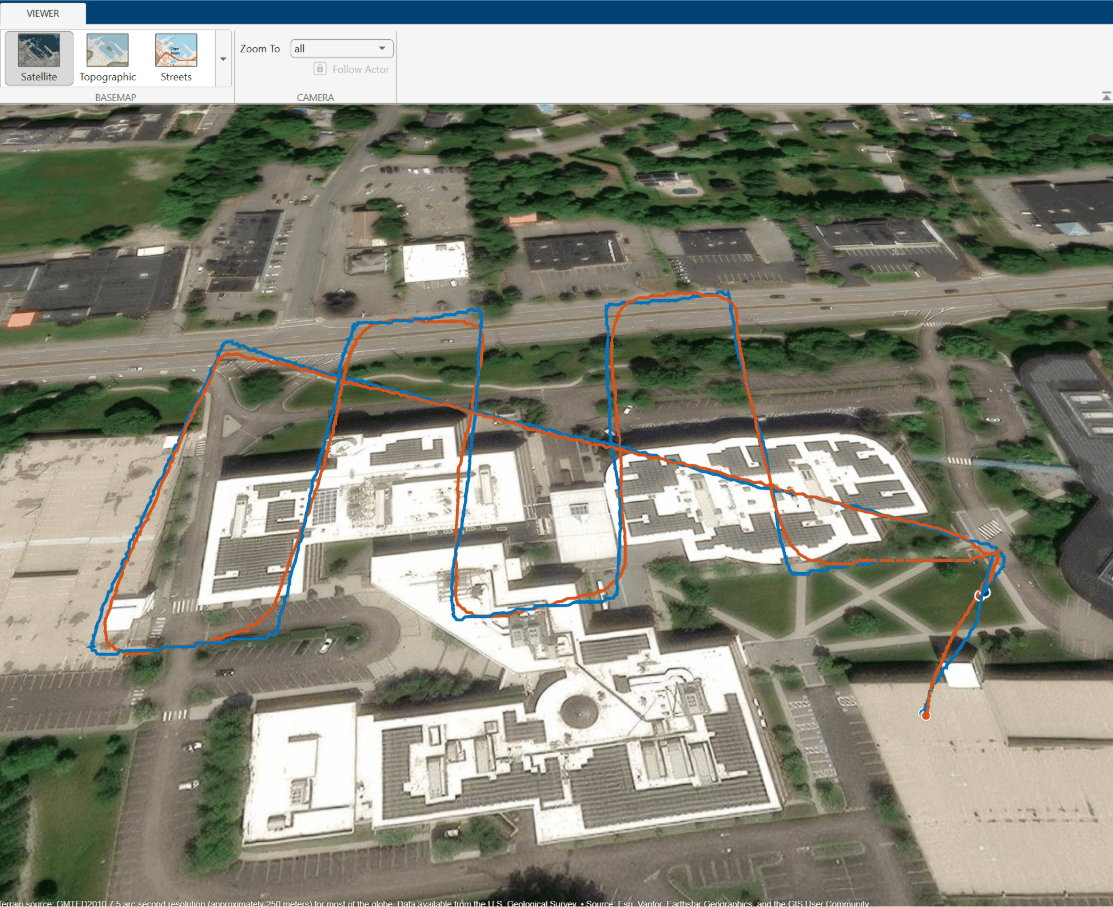
Plot both trajectories and mark start and end points.
% UAV 1 trajectory (blue)
traj1 = plotline(v,pointtable(lat,lon,alt),Color=[0 114 189]/255,LineWidth=3);
startPt1 = plotpoints(v,pointtable(lat(1),lon(1),alt(1)),MarkerFaceColor=[0 114 189]/255,MarkerEdgeColor="w");
endPt1 = plotpoints(v,pointtable(lat(end),lon(end),alt(end)),MarkerFaceColor=[0 57 94]/255,MarkerEdgeColor="w");

% UAV 2 trajectory (orange)
traj2 = plotline(v,pointtable(lat2,lon2,alt2),Color=[217 83 25]/255,LineWidth=3);
startPt2 = plotpoints(v,pointtable(lat2(1),lon2(1),alt2(1)),MarkerFaceColor=[217 83 25]/255,MarkerEdgeColor="w");
endPt2 = plotpoints(v,pointtable(lat2(end),lon2(end),alt2(end)),MarkerFaceColor=[108 41 12]/255,MarkerEdgeColor="w");
Play Back a Flight Segment
Select a time window to play back a portion of both flights instead of the entire log, allowing you to focus on specific maneuvers or events of interest. This example updates actor positions and orientations directly at each time step rather than assigning trajectories, because the flight data from MAVLink logs contains irregularly sampled GPS and attitude measurements that do not conform to a fixed-rate trajectory.
Convert timestamps to elapsed seconds for each flight log.
timeData1 = seconds(latlon.Time(uniqueIdx) - latlon.Time(1));
timeData2 = seconds(latlon2.Time(uniqueIdx2) - latlon2.Time(1));
Configure the time range and step size for replay.
timeStep = 1;
The sample flight logs span approximately 185–213 seconds each. This example replays the 30–100 second interval. Adjust startTime and endTime to focus on any portion of the flights.
startTime = 30;
endTime = 100;
Update the trajectory lines, start/end markers, and actor positions to reflect the selected interval. The updateFlightSegment function is included with this example as a supporting file.
[startIdx1,endIdx1] = updateFlightSegment(timeData1,startTime,endTime,waypoints,yaw,pitch,roll,ac1,traj1,startPt1,endPt1);
[startIdx2,endIdx2] = updateFlightSegment(timeData2,startTime,endTime,waypoints2,yaw2,pitch2,roll2,ac2,traj2,startPt2,endPt2);
Step through both UAV trajectories over the selected time window.
selectedTime = startTime:timeStep:endTime;
for t = selectedTime
    % Update UAV 1 pose and FRD vectors
    idx1 = find(timeData1 <= t,1,"last");
    if ~isempty(idx1) && timeData1(idx1) >= startTime
        newPose1 = pose(waypoints(idx1,:),quaternion([yaw(idx1) pitch(idx1) roll(idx1)],"eulerd","ZYX","frame"),ReferenceFrame=nedFrame);
        pose(ac1,newPose1);
        updateFRDVectors(newPose1,vectorScale,fwdLine1,rightLine1,downLine1);
    end

    % Update UAV 2 pose and FRD vectors
    idx2 = find(timeData2 <= t,1,"last");
    if ~isempty(idx2) && timeData2(idx2) >= startTime
        newPose2 = pose(waypoints2(idx2,:),quaternion([yaw2(idx2) pitch2(idx2) roll2(idx2)],"eulerd","ZYX","frame"),ReferenceFrame=nedFrame);
        pose(ac2,newPose2);
        updateFRDVectors(newPose2,vectorScale,fwdLine2,rightLine2,downLine2);
    end

    drawnow limitrate
end
function [fwdLine,rightLine,downLine] = createFRDVectors(v,lat,lon,alt)
pos = pointtable(lat,lon,alt);
fwdLine = plotline(v,[pos; pos],Color="r",LineWidth=3);
rightLine = plotline(v,[pos; pos],Color="g",LineWidth=3);
downLine = plotline(v,[pos; pos],Color="b",LineWidth=3);
end

function updateFRDVectors(actorPose,scale,fwdLine,rightLine,downLine)
lat0 = actorPose.Position(1);
lon0 = actorPose.Position(2);
alt0 = actorPose.Position(3);
fwd = actorPose.Forward * scale;
rgt = actorPose.Right * scale;
dwn = actorPose.Down * scale;
[fLat,fLon,fAlt] = ned2geodetic(fwd(1),fwd(2),fwd(3),lat0,lon0,alt0,wgs84Ellipsoid);
[rLat,rLon,rAlt] = ned2geodetic(rgt(1),rgt(2),rgt(3),lat0,lon0,alt0,wgs84Ellipsoid);
[dLat,dLon,dAlt] = ned2geodetic(dwn(1),dwn(2),dwn(3),lat0,lon0,alt0,wgs84Ellipsoid);
origin = pointtable(lat0,lon0,alt0);
fwdLine.Data = [origin; pointtable(fLat,fLon,fAlt)];
rightLine.Data = [origin; pointtable(rLat,rLon,rAlt)];
downLine.Data = [origin; pointtable(dLat,dLon,dAlt)];
end

