anomalyMapOverlay
R2026bDescription
specifies options using one or more name-value arguments. For example,
B = anomalyMapOverlay(I,map,Name=Value)anomalyMapOverlay(I,map,Blend="equal") blends the score map and the
background image with equal weighting.
Examples
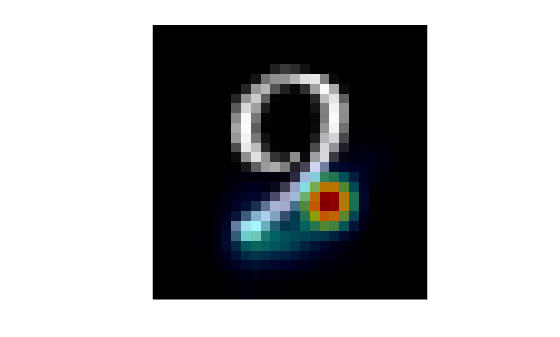
Load a pretrained FCDD anomaly detector. This detector has been trained to classify the digit 8 as normal and all other digits as anomalies.
load("digit8AnomalyDetector.mat");Load test images and corresponding labels, then convert the test images to a formatted dlarray with the format label "SSCB" for spatial-spatial-channel-batch. The data set consists of grayscale images of handwritten digits 0–9.
[Xtest,gtLabels] = digitTest4DArrayData;
Select a test image of the digit 9.
digitToTest = "9";
digitIdx = find(gtLabels==digitToTest,1);
imTest = Xtest(:,:,:,digitIdx);Predict the per-pixel anomaly scores for the test image.
map = anomalyMap(detector,imTest);
Display the anomaly map over the test image.
overlay = anomalyMapOverlay(imTest,map); imagesc(overlay) axis image off
Input Arguments
Background image, specified in one of these formats:
M-by-N-by-3 numeric array representing a truecolor image
M-by-N numeric matrix representing a grayscale image
M-by-N logical matrix representing a binary image
Anomaly score map, specified as an M-by-N
numeric matrix. You can get an anomaly score map using the anomalyMap function. Larger values indicate a greater chance that a pixel
is an anomaly.
Name-Value Arguments
Specify optional pairs of arguments as
Name1=Value1,...,NameN=ValueN, where Name is
the argument name and Value is the corresponding value.
Name-value arguments must appear after other arguments, but the order of the
pairs does not matter.
Example: B = anomalyMapOverlay(I,map,Blend="equal") blends the score
map and the background image with equal weighting.
Display range of the anomaly score map, map. The default
value is [min(map(:)) max(map(:))].
Weights to blend the map with background image I, specified
as "proportional", "equal", or a numeric scalar
in the range [0, 1].
| Value | Description |
|---|---|
"proportional" | Overlay I and map using alpha
blending with per-pixel weights proportional to the corresponding values in
map. The heatmap is more opaque over regions of
interest, which have large anomaly scores. The heatmap is more transparent
over normal regions, which have small anomaly scores. |
"equal" | Overlay I and map using alpha
blending with equal weights for the map and background image. |
| numeric scalar | Overlay I and map using alpha
blending with weight w for the map, where
w is the value of the Blend
argument. When w is 0, the heatmap is
fully transparent and only the background image is visible. When you increase
the value of w, the heatmap becomes more opaque. |
For all values of Blend, the weight of the heatmap has an
additional multiplicative scale factor, specified by BlendFactor.
When you account for the additional scale factor, the weight of the heatmap is w*BlendFactor and the weight of the background image is 1 – w*BlendFactor.
Constant multiplicative factor to apply to the weights of the
Blend argument, specified as a numeric scalar. Increasing the
value of BlendFactor increases the brightness of the heatmap over
the image.
Example: BlendFactor=1.2 brightens the heatmap by increasing the
weighting by a factor of 1.2.
Example: BlendFactor=0.6 darkens the heatmap by decreasing the
weighting by a factor of 0.6.
Colormap, specified as a 256-by-3 numeric matrix with values in the range [0, 1]. Each row is a three-element RGB triplet that specifies the red, green, and blue components of a single color of the colormap.
Data Types: single | double
Output Arguments
RGB image with heatmap overlay, returned as an M-by-N-by-3 numeric array.
Data Types: uint8
Version History
Introduced in R2022bStarting in R2026b, anomalyMapOverlay is available
in the Visual Inspection
Toolbox™ product. In releases R2026a and before, anomalyMapOverlay is available
in the Automated Visual Inspection Library for Computer Vision Toolbox™ add-on.
MATLAB Command
You clicked a link that corresponds to this MATLAB command:
Run the command by entering it in the MATLAB Command Window. Web browsers do not support MATLAB commands.
Seleccione un país/idioma
Seleccione un país/idioma para obtener contenido traducido, si está disponible, y ver eventos y ofertas de productos y servicios locales. Según su ubicación geográfica, recomendamos que seleccione: .
También puede seleccionar uno de estos países/idiomas:
Cómo obtener el mejor rendimiento
Seleccione China (en idioma chino o inglés) para obtener el mejor rendimiento. Los sitios web de otros países no están optimizados para ser accedidos desde su ubicación geográfica.
América
- América Latina (Español)
- Canada (English)
- United States (English)
Europa
- Belgium (English)
- Denmark (English)
- Deutschland (Deutsch)
- España (Español)
- Finland (English)
- France (Français)
- Ireland (English)
- Italia (Italiano)
- Luxembourg (English)
- Netherlands (English)
- Norway (English)
- Österreich (Deutsch)
- Portugal (English)
- Sweden (English)
- Switzerland
- United Kingdom (English)