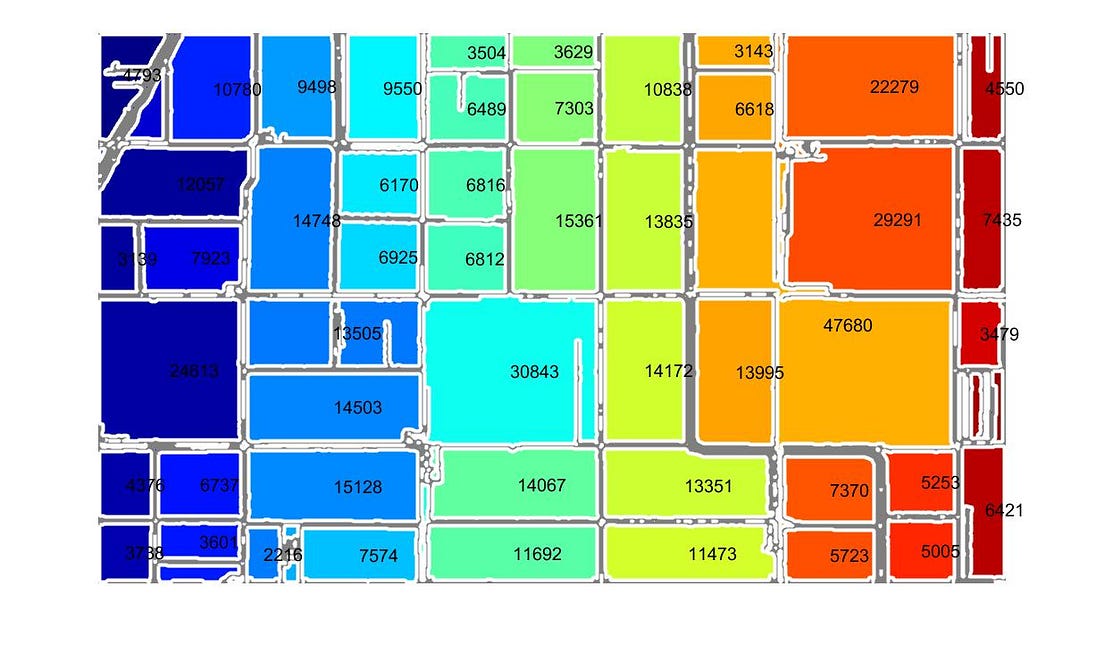
Can someone please convert the Matlab code to Python code??
6 visualizaciones (últimos 30 días)
Mostrar comentarios más antiguos
%upload image of farm
figure,
farm = imread('small_farms.JPG');%change this to the file path of image
imshow(farm);%this shows the original image
%convert the image to grayscale for 2D manipulation
gfarm = rgb2gray(farm);
figure,
imshow(gfarm);%show grayscaled image
%median filters take a m*n area around a coordinate and
%find the median pixel value and set that coordinate to that
%pixel value. It's a method of removing noise or details in an
%image. may want to tune dimensions of filter.
A = medfilt2(gfarm,[4 4]);
figure,
imshow(A);
%perform a logarithmic edge detection filter,
%this picks out the edges of the image, log setting
%was found to wrok best, although 'Sobel' can also be tried
B = edge(A,'log');
%show results of the edge filter
figure,
imshow(B,[]);
%find the areas of the lines made
areas = regionprops(B,'Area');
%find the mean and one standard deviation
men = mean([areas.Area])+0*std([areas.Area]);
%find max pixel area
big = max([areas.Area]);
%remove regions that are too small
C = bwpropfilt(B,'Area',[men big]);
%perform a dilation on the remaining pixels, this
%helps fill in gaps. The size and shape of the dilation
%can be tuned below.
SE = strel('square',4);
C = imdilate(C,SE);
areas2 = regionprops(C,'Area');
%place white border around image to find areas of farms
%that go off the picture
[h,w] = size(C);
C(1,:) = 1;
C(:,1) = 1;
C(h,:) = 1;
C(:,w) = 1;
C = C<1;
%fill in holes
C = imfill(C,'holes');
%show final processed image
figure,imshow(C);
%the section below is for display purpose
%it creates the boundaries of the image and displays them
%in a rainbow fashion
figure,
[B,L,n,A] = bwboundaries(C,'noholes');
imshow(label2rgb(L, @jet, [.5 .5 .5]))
hold on
for k = 1:length(B)
boundary = B{k};
plot(boundary(:,2), boundary(:,1), 'w', 'LineWidth', 2)
end
%The section below prints out the areas of each found
%region by pixel values. These values need to be scaled
%by the real measurements of the images to get relevant
%metrics
centers = regionprops(C,'Centroid','Area');
for k=1:length(centers)
if(centers(k).Area > mean([centers.Area])-std([areas.Area]))
text(centers(k).Centroid(1),centers(k).Centroid(2),string(centers(k).Area));
end
end

0 comentarios
Respuestas (0)
Ver también
Categorías
Más información sobre Call Python from MATLAB en Help Center y File Exchange.
Community Treasure Hunt
Find the treasures in MATLAB Central and discover how the community can help you!
Start Hunting!
