Resultados de
For the www, uk, and in domains,a generative search answer is available for Help Center searches. Please let us know if you get good or bad results for your searches. Some have pointed out that it is not available in non-english domains. You can switch your country setting to try it out. You can also ask questions in different languages and ask for the response in a different language. I get better results when I ask more specific queries. How is it working for you?
Hello MATLAB Central community,
My name is Yann. And I love MATLAB. I also love Python ... 🐍 (I know, not the place for that).
I recently decided to go down the rabbit hole of AI. So I started benchmarking deep learning frameworks on basic examples. Here is a recording of my experiment:
Happy to engage in the debate. What do you think?
Large Language Models (LLMs) with MATLAB was updated again today to support the newly released OpenAI models GPT-5, GPT-5 mini, GPT-5 nano, GPT-5 chat, o3, and o4-mini. When you create an openAIChat object, set the ModelName name-value argument to "gpt-5", "gpt-5-mini", "gpt-5-nano", "gpt-5-chat-latest", "o4-mini", or "o3".
This is version 4.4.0 of this free MATLAB add-on that lets you interact with LLMs on MATLAB. The release notes are at Release v4.4.0: Support for GPT-5, o3, o4-mini · matlab-deep-learning/llms-with-matlab
作ったコードは公開して使ってもらいましょう!ということでその方法をブログで紹介します。
GitHub や File Exchange で公開しているコードがあれば、ぜひこのスレで教えてください!
ブログで紹介している大まかな3ステップをここにまとめます。
1. GitHub でコードを公開・開発する
- GitHub 上でのリポジトリ公開はコミュニティ形成にもつながります。
- R2025a 以降は MATLAB の Markdown サポートも強化されており、README.md を充実させると理解や導入が促進されます。
2. File Exchange に展開(GitHub と連携して自動同期)
- File Exchangeで公開することで MATLAB 内から検索・インストールが可能になります。
- GitHub と File Exchange の連携設定により、GitHub の更新を自動的に File Exchange に反映させることも可能です。
3. 「Open in MATLAB Online」ボタンやリンクを追加
- GitHub リポジトリに「Open in MATLAB Online」リンクやボタンを埋め込むことで、ブラウザ上でコードを試せます。
群馬産業技術センター様をお招きし、製造現場での異常検知の取り組みについてご紹介いただくオンラインセミナーを開催します。
実際の開発事例を通して、MATLABを使った「教師なし」異常検知の進め方や、予知保全に役立つ最新機能もご紹介します。
✅ 異常検知・予知保全に興味がある方
✅ データ活用を何から始めればいいか迷っている方
✅ 実際の現場事例を知りたい方
ぜひお気軽にご参加ください!
Simulinkモデルを生成AIで自動的に作成できたら便利だと思いませんか?
QiitaのSacredTubesさんは、このアイデアを実験的に試みた記事を公開しています。
その方法は、まず生成AIでVerilogコードを作成し、それをSimulinkに取り込んでモデル化するというものです。(ここではHDL Coderというツールボックスの機能が使われました:importhdl)
まだ実用段階には至っていませんが、モデルベース開発(MBD)と生成AIの可能性を探る上で、非常に興味深い試みです。
生成AIの限界と可能性を考えるきっかけとして、一読の価値があります。
---
もし「Simulink Copilot」のような生成AIツールが登場するとしたら、
どんな機能があったら嬉しいと思いますか?
- 自然言語でブロック図を生成?
- 既存モデルの自動ドキュメント化?
- シミュレーション結果の要約と解釈?
皆さんのアイデアをぜひシェアしてください!
- 昨日までちゃんと動いていたのに・・
- ヘルプページ通りに書いているのに・・
MATLAB 関数がエラーを出すようになることありますよね(?)そんな時にみなさんがまず確認するもの、何かありますか?教えてください!
例えば
which -all plot
をコマンドウィンドウで実行して、もともと MATLAB で定義されている plot 関数(MATLAB のインストールフォルダにある plot 関数)がちゃんと頭に出てくるかどうか確認します。
キーと値の組み合わせでデータを格納できるディクショナリ。R2022bでdictionaryコマンドが登場し、最近のバージョンではreaddictionaryとwritedictionaryでJSONファイルからの読み込み・書き込みにも対応しました。
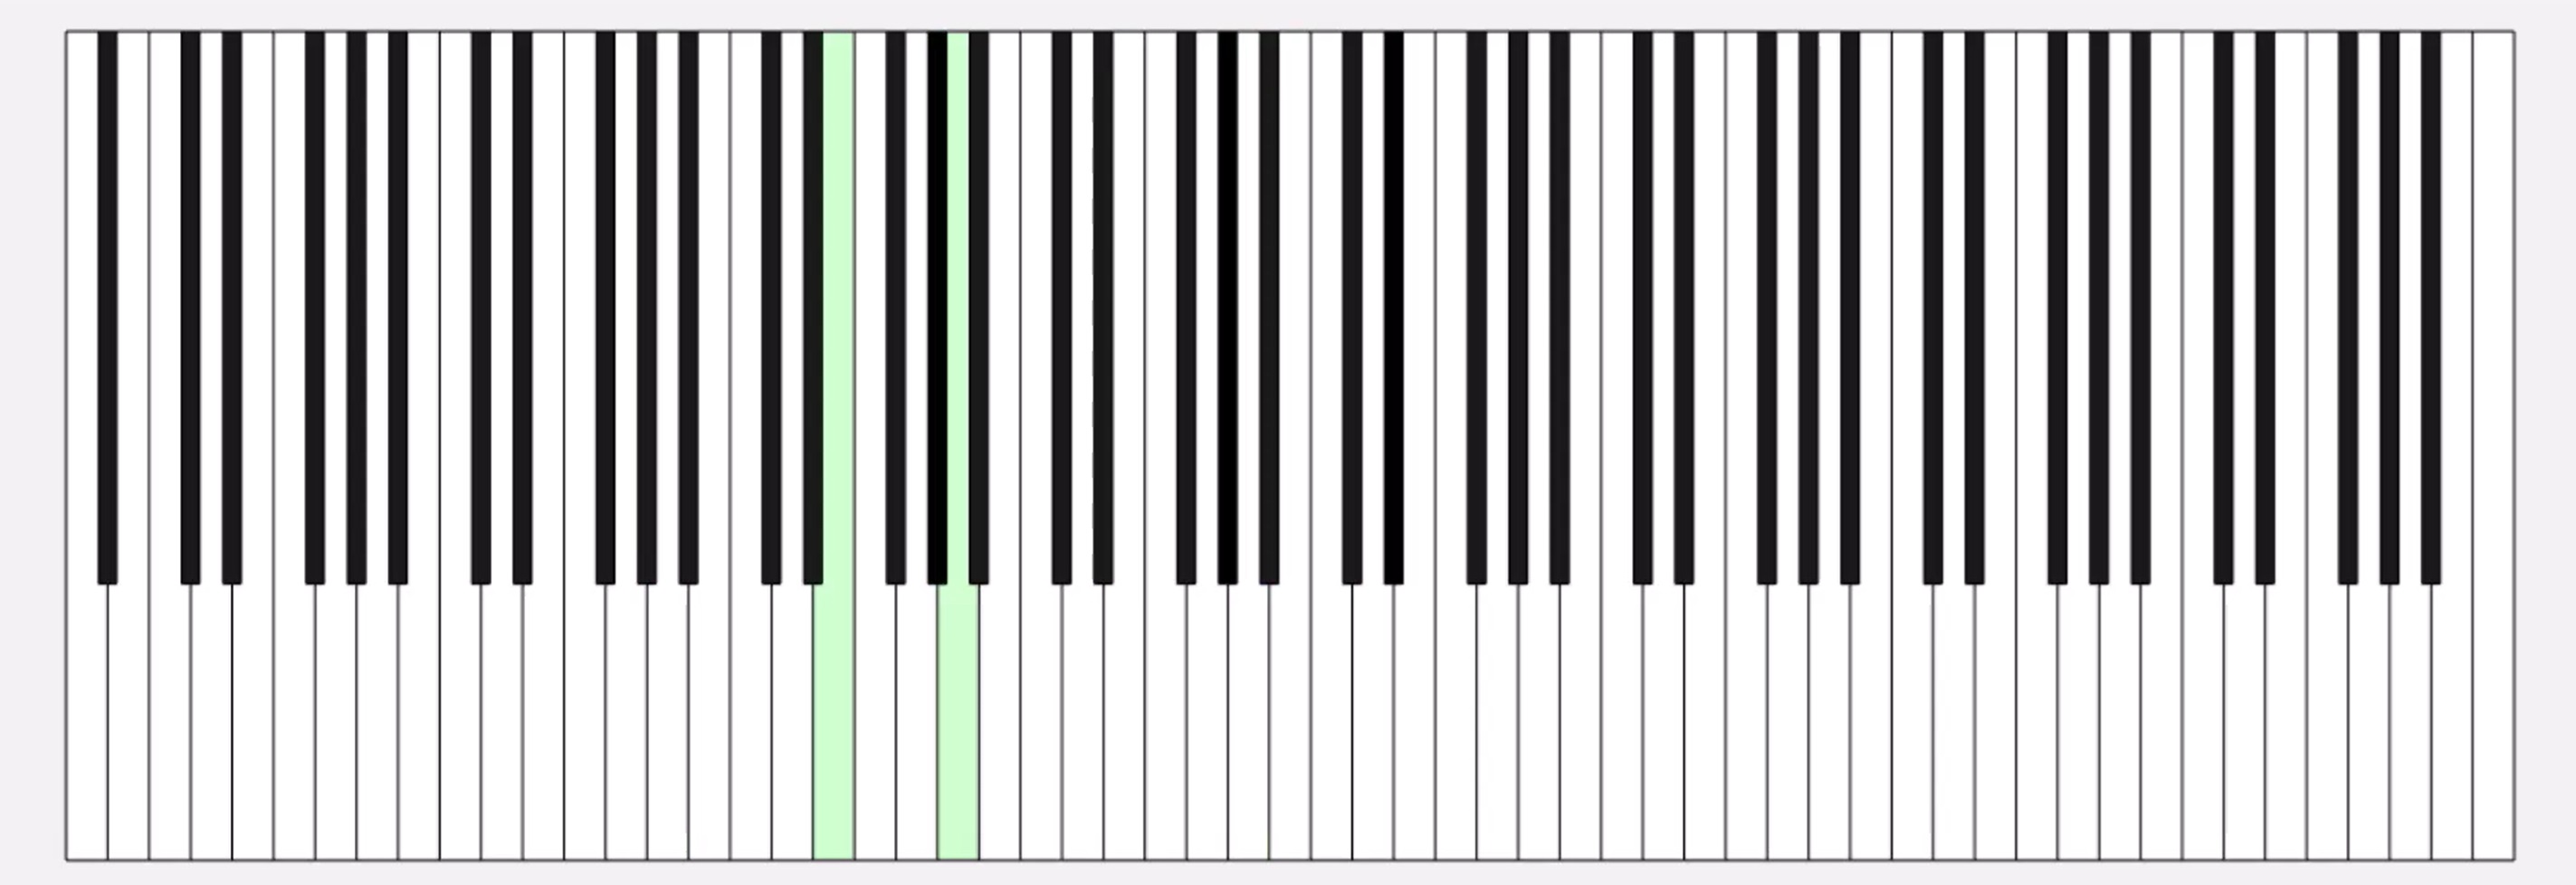
私はMIDIデータからピアノの演奏動画を作るプログラムで、ディクショナリを使いました。音のノート番号をキーにして、patchで白と黒で鍵盤を塗りつぶしたmatlab.graphics.Graphicsデータ型を値にしたディクショナリで保存して、MIDIで鳴らされた音のノート番号からlookupでグラフのオブジェクトを取得し、FaceColorを変更してハイライトするというもの。
コード例
%% MIDIデータの.matファイルを読み取ってピアノを描画するサンプル
fig = figure('Position', [34 328 1626 524]);
ax = axes;
whiteKeyY = [0 0 150 150];
whiteKeyColor = [1 1 1];
blackKeyY = [50 50 150 150];
blackKeyColor = [0.1 0.1 0.1];
edgeColor = [0 0 0];
% ディクショナリの定義
d = configureDictionary("double", "matlab.graphics.Graphics");
% 白鍵を描画
for n = 1:9
pos = 23*7*(n-1);
d = insert(d, 21 + (n-1)*12, patch([pos+5 pos+28 pos+28 pos+5],whiteKeyY, whiteKeyColor, 'EdgeColor', edgeColor, 'UserData', 21 + (n-1)*12));
d = insert(d, 23 + (n-1)*12, patch([pos+28 pos+51 pos+51 pos+28], whiteKeyY, whiteKeyColor, 'EdgeColor', edgeColor, 'UserData', 23 + (n-1)*12));
d = insert(d, 24 + (n-1)*12, patch([pos+51 pos+74 pos+74 pos+51], whiteKeyY, whiteKeyColor, 'EdgeColor', edgeColor, 'UserData', 24 + (n-1)*12));
if n < 9
d = insert(d, 26 + (n-1)*12, patch([pos+74 pos+97 pos+97 pos+74], whiteKeyY, whiteKeyColor, 'EdgeColor', edgeColor, 'UserData', 26 + (n-1)*12));
d = insert(d, 28 + (n-1)*12, patch([pos+97 pos+120 pos+120 pos+97], whiteKeyY, whiteKeyColor, 'EdgeColor', edgeColor, 'UserData', 28 + (n-1)*12));
d = insert(d, 29 + (n-1)*12, patch([pos+120 pos+143 pos+143 pos+120], whiteKeyY, whiteKeyColor, 'EdgeColor', edgeColor, 'UserData', 29 + (n-1)*12));
d = insert(d, 31 + (n-1)*12, patch([pos+143 pos+166 pos+166 pos+143], whiteKeyY, whiteKeyColor, 'EdgeColor', edgeColor, 'UserData', 31 + (n-1)*12));
end
end
% 黒鍵を描画。白鍵の上になるようにループを分けています
for n = 1:9
pos = 23*7*(n-1);
d = insert(d, 22 + (n-1)*12, patch([pos+23 pos+33 pos+33 pos+23], blackKeyY, blackKeyColor, 'EdgeColor', [0 0 0], 'UserData', 22 + (n-1)*12));
if n < 9
d = insert(d, 25 + (n-1)*12, patch([pos+69 pos+79 pos+79 pos+69], blackKeyY, blackKeyColor, 'EdgeColor', [0 0 0], 'UserData', 25 + (n-1)*12));
d = insert(d, 27 + (n-1)*12, patch([pos+92 pos+102 pos+102 pos+92], blackKeyY, blackKeyColor, 'EdgeColor', [0 0 0], 'UserData', 27 + (n-1)*12));
d = insert(d, 30 + (n-1)*12, patch([pos+138 pos+148 pos+148 pos+138], blackKeyY, blackKeyColor, 'EdgeColor', [0 0 0], 'UserData', 30 + (n-1)*12));
d = insert(d, 32 + (n-1)*12, patch([pos+161 pos+171 pos+171 pos+161], blackKeyY, blackKeyColor, 'EdgeColor', [0 0 0], 'UserData', 32 + (n-1)*12));
end
end
xticklabels({})
yticklabels({})
xlim([5 1362])
drawnow
%% MIDI音源の.matファイルを読み込み
matData = load('fur-elise.mat');
msg = matData.receivedMessages;
eventTimes = [msg.Timestamp] - msg(1).Timestamp;
n = 1;
numNotes = 0;
lastNote = 0;
highlightedCircles = cell(1, 127);
% 音が鳴った鍵盤だけハイライトする
tic
while toc < max(eventTimes)
if toc > eventTimes(n)
thisMsg = msg(n);
if thisMsg.Type == "NoteOn"
numNotes = numNotes + 1;
lastNote = thisMsg.Note;
thisPatch = lookup(d, thisMsg.Note);
thisPatch.FaceColor = '#CCFFCC';
drawnow
elseif thisMsg.Type == "NoteOff"
numNotes = 0;
thisPatch = lookup(d, thisMsg.Note);
[~, ~, wOrB] = calcNotePos(thisMsg.Note);
if wOrB == "w"
thisPatch.FaceColor = 'white';
else
thisPatch.FaceColor = 'black';
end
drawnow
end
n = n+1;
end
end
%% サブ関数
function [pianoPos, centerPos, wOrB] = calcNotePos(note)
tempVar = idivide(int64(note), int64(12)); % 12で割った商
pos = 23*7*(tempVar-1);
switch mod(note, 12)
case 0 % C
pianoPos = pos + 62.5;
centerPos = 30;
wOrB = "w";
case 2 % D
pianoPos = pos + 85.5;
centerPos = 30;
wOrB = "w";
case 4 % E
pianoPos = pos + 108.5;
centerPos = 30;
wOrB = "w";
case 5 % F
pianoPos = pos + 131.5;
centerPos = 30;
wOrB = "w";
case 7 % G
pianoPos = pos + 154.5;
centerPos = 30;
wOrB = "w";
case 9 % A
pianoPos = pos + 177.5;
centerPos = 30;
wOrB = "w";
case 11 % B
pianoPos = pos + 200.5;
centerPos = 30;
wOrB = "w";
case 1 % C#
pianoPos = pos + 69;
centerPos = 100;
wOrB = "b";
case 3 % D#
pianoPos = pos + 92;
centerPos = 100;
wOrB = "b";
case 6 % F#
pianoPos = pos + 138;
centerPos = 100;
wOrB = "b";
case 8 % G#
pianoPos = pos + 161;
centerPos = 100;
wOrB = "b";
case 10 % A#
pianoPos = pos + 184;
centerPos = 100;
wOrB = "b";
end
end
皆さんはディクショナリを使ってますか? もし使っていたら、どういう活用をしているか、聞かせてください!
どの方法を使う事が多いですか?他によく使う方法があれば教えてくださいー。
方法①
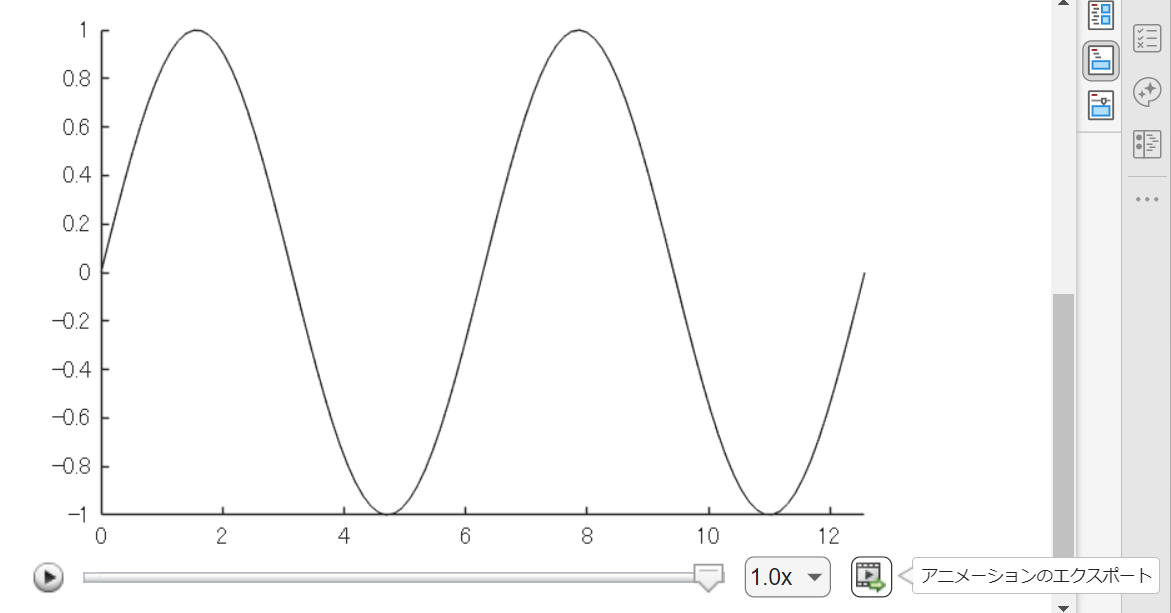
Livescript 上で for ループ内で描画を編集させて描いた動画は「アニメーションのエクスポート」から動画ファイルに出力するのが一番簡単ですね。再生速度やら細かい設定ができない点は要注意。
方法②
exportgraphics 関数で "Append" オプション指定で実現できるようになった(R2022a から)のでこれも便利ですね。
N = 100;
x = linspace(0,4*pi,N);
y = sin(x);
filename = 'animation_sample.gif'; % Specify the output file name
if exist(filename,'file')
delete(filename)
end
h = animatedline;
axis([0,4*pi,-1,1]) % x軸の表示範囲を固定
for k = 1:length(x)
addpoints(h,x(k),y(k)); % ループでデータを追加
exportgraphics(gca,filename,"Append",true)
end
方法③
R2021b 以前のバージョンだとこんな感じ。
各ループで画面キャプチャして、imwrite で動画ファイルにフレーム追加していくイメージです。"DelayTime" を使って細かい指定ができるので、必要に応じて今でも利用します。
for k = 1:length(x)
addpoints(h,x(k),y(k)); % ループでデータを追加
drawnow % グラフアップデート
frame = getframe(gcf); % Figure 画面をムービーフレーム(構造体)としてキャプチャ
tmp = frame2im(frame); % 画像に変更
[A,map] = rgb2ind(tmp,256); % RGB -> インデックス画像に
if k == 1 % 新規 gif ファイル作成
imwrite(A,map,filename,'gif','LoopCount',Inf,'DelayTime',0.2);
else % 以降、画像をアペンド
imwrite(A,map,filename,'gif','WriteMode','append','DelayTime',0.2);
end
end
これからは生成AIでコードを1から書くという事が減ってくるのかと思いますが,皆さんがMATLABのコードを書く時に意識しているご自身のルールのようなものがあれば教えてください.
MATLAB言語は柔軟に書けますが,自然と個人個人のルールというものが出来上がってきているのでは,と思います.
私はParameter, Valueペアの引数がある関数はそれぞれのペアを新しい行に書く,というのをよくやります.
h = plot(x, y, "ro-", ...
"LineWidth", 2, ...
"MarkerSize", 10, ...
"MarkerFaceColor", "g");
Parameter=Valueでも同じです.
h = plot(x, y, "ro-", ...
LineWidth = 2, ...
MarkerSize = 10, ...
MarkerFaceColor = "g");
また,一時期は "=" を揃えることもやってました(今はやってませんが).
h = plot(x, y, "ro-", ...
LineWidth = 2, ...
MarkerSize = 10, ...
MarkerFaceColor = "g");
皆さんにはどのようなルールがありますか?
The Graphics and App Building Blog just launched its first article on R2025a features, authored by Chris Portal, the director of engineering for the MATLAB graphics and app building teams.
Over the next few months, we'll publish a series of articles that showcase our updated graphics system, introduce new tools and features, and provide valuable references enriched by the perspectives of those involved in their development.
To stay updated, you can subscribe to the blog (look for the option in the upper left corner of the blog page). We also encourage you to join the conversation—your comments and questions under each article help shape the discussion and guide future content.
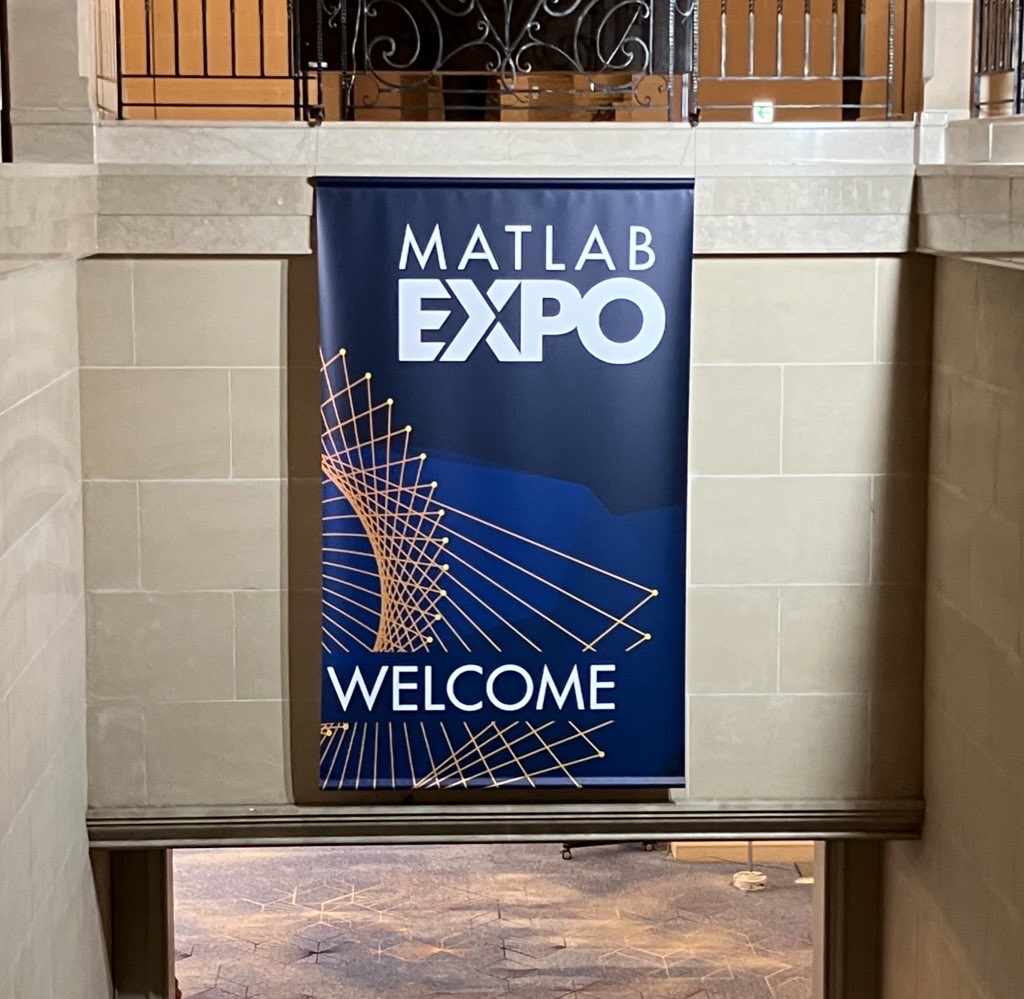
昨日 5/29 にお台場で MATLAB EXPO が開催されました。ご参加くださった方々ありがとうございました!
私は AI 関連のデモ展示で解説員としても立っておりましたが、立ち寄ってくださる方が絶えず、ずっと喋り続けてました。また、講演後に「さっきのすごくね?」という会話が漏れ聞こえてきたのがハイライト。
参加されたみなさま、印象に残ったこと・気になった講演・ポスター・デモ・新機能等あったら教えてください!(次回に向けて運営面での感想も)
以前のEXPOでも参加・聴講したことがある
67%
知り合いから聞いた
0%
MathWorksからのプロモーション,EXPOサイトで知った
0%
今年のEXPO会場でたまたま見かけた
0%
ライトニングトークって何?
33%
3 votos
Large Languge model with MATLAB, a free add-on that lets you access LLMs from OpenAI, Azure, amd Ollama (to use local models) on MATLAB, has been updated to support OpenAI GPT-4.1, GPT-4.1 mini, and GPT-4.1 nano.
According to OpenAI, "These models outperform GPT‑4o and GPT‑4o mini across the board, with major gains in coding and instruction following. They also have larger context windows—supporting up to 1 million tokens of context—and are able to better use that context with improved long-context comprehension."
What would you build with the latest update?

Provide insightful answers
9%
Provide label-AI answer
9%
Provide answer by both AI and human
21%
Do not use AI for answers
46%
Give a button "chat with copilot"
10%
use AI to draft better qustions
5%
1561 votos
%% 清理环境
close all; clear; clc;
%% 模拟时间序列
t = linspace(0,12,200); % 时间从 0 到 12,分 200 个点
% 下面构造一些模拟的"峰状"数据,用于演示
% 你可以根据需要替换成自己的真实数据
rng(0); % 固定随机种子,方便复现
baseIntensity = -20; % 强度基线(z 轴的最低值)
numSamples = 5; % 样本数量
yOffsets = linspace(20,140,numSamples); % 不同样本在 y 轴上的偏移
colors = [ ...
0.8 0.2 0.2; % 红
0.2 0.8 0.2; % 绿
0.2 0.2 0.8; % 蓝
0.9 0.7 0.2; % 金黄
0.6 0.4 0.7]; % 紫
% 构造一些带多个峰的模拟数据
dataMatrix = zeros(numSamples, length(t));
for i = 1:numSamples
% 随机峰参数
peakPositions = randperm(length(t),3); % 三个峰位置
intensities = zeros(size(t));
for pk = 1:3
center = peakPositions(pk);
width = 10 + 10*rand; % 峰宽
height = 100 + 50*rand; % 峰高
% 高斯峰
intensities = intensities + height*exp(-((1:length(t))-center).^2/(2*width^2));
end
% 再加一些小随机扰动
intensities = intensities + 10*randn(size(t));
dataMatrix(i,:) = intensities;
end
%% 开始绘图
figure('Color','w','Position',[100 100 800 600],'Theme','light');
hold on; box on; grid on;
for i = 1:numSamples
% 构造 fill3 的多边形顶点
xPatch = [t, fliplr(t)];
yPatch = [yOffsets(i)*ones(size(t)), fliplr(yOffsets(i)*ones(size(t)))];
zPatch = [dataMatrix(i,:), baseIntensity*ones(size(t))];
% 使用 fill3 填充面积
hFill = fill3(xPatch, yPatch, zPatch, colors(i,:));
set(hFill,'FaceAlpha',0.8,'EdgeColor','none'); % 调整透明度、去除边框
% 在每条曲线尾部标注 Sample i
text(t(end)+0.3, yOffsets(i), dataMatrix(i,end), ...
['Sample ' num2str(i)], 'FontSize',10, ...
'HorizontalAlignment','left','VerticalAlignment','middle');
end
%% 坐标轴与视角设置
xlim([0 12]);
ylim([0 160]);
zlim([-20 350]);
xlabel('Time (sec)','FontWeight','bold');
ylabel('Frequency (Hz)','FontWeight','bold');
zlabel('Intensity','FontWeight','bold');
% 设置刻度(根据需要微调)
set(gca,'XTick',0:2:12, ...
'YTick',0:40:160, ...
'ZTick',-20:40:200);
% 设置视角(az = 水平旋转,el = 垂直旋转)
view([211 21]);
% 让三维坐标轴在后方
set(gca,'Projection','perspective');
% 如果想去掉默认的坐标轴线,也可以尝试
% set(gca,'BoxStyle','full','LineWidth',1.2);
%% 可选:在后方添加一个浅色网格平面 (示例)
% 这个与题图右上方的网格类似
[Xplane,Yplane] = meshgrid([0 12],[0 160]);
Zplane = baseIntensity*ones(size(Xplane)); % 在 Z = -20 处画一个竖直面的框
surf(Xplane, Yplane, Zplane, ...
'FaceColor',[0.95 0.95 0.9], ...
'EdgeColor','k','FaceAlpha',0.3);
%% 进一步美化(可根据需求调整)
title('3D Stacked Plot Example','FontSize',12);
constantplane("x",12,FaceColor=rand(1,3),FaceAlpha=0.5);
constantplane("y",0,FaceColor=rand(1,3),FaceAlpha=0.5);
constantplane("z",-19,FaceColor=rand(1,3),FaceAlpha=0.5);
hold off;

Have fun! Enjoy yourself!
Hello Community,
We're excited to announce that registration is now open for the MathWorks AUTOMOTIVE CONFERENCE 2025! This event presents a fantastic opportunity to connect with MathWorks and industry experts while exploring the latest trends in the automotive sector.
Event Details:
- Date: April 29, 2025
- Location: St. John’s Resort, Plymouth, MI
Featured Topics:
- Virtual Development
- Electrification
- Software Development
- AI in Engineering
Whether you're a professional in the automotive industry or simply interested in these cutting-edge topics, we highly encourage you to register for this conference.
We look forward to seeing you there!
We are excited to announce another update to our Discussions area: the new Contribution Widget! The new widget simplifies the process of creating diverse types of content, whether you're praising someone who has helped you, sharing tips and tricks, or polling the community.
Previously, creating various types of content required navigating multiple links or channels. With the new Contribution Widget, everything you need is conveniently located in one place.
Give it a try and let us know how we can further enhance your user experience.
P.S. Who has been particularly helpful to you lately? Create your first praise post and let them know!