Resultados de
Bom dia se alguém puder me ajudar, meu código abaixo, não estou conseguintdo conectar o meu Esp8266 ao ThingSpeak, o erro tá na conexão. Estou usando o MicroPython e NodeMCU na plataforma Pytohn o sistema operacional Ubuntu 20
# DHT11 -> ESP8266/ESP32
# 1(Vcc) -> 3v3
# 2(Data) -> GPIO12
# 4(Gnd) -> Gnd
import time, network, machine
from dht import DHT11
from machine import Pin
from umqtt.simple import MQTTClient
print("Iniciando...")
dht = DHT11(Pin(12, Pin.IN, Pin.PULL_UP))
estacao = network.WLAN(network.STA_IF)
estacao.active(True)
estacao.connect('xxxxxxx', 'xxxxxxxxx')
while estacao.isconnected() == False:
machine.idle()
print('Conexao realizada.')
print(estacao.ifconfig())
SERVIDOR = "mqtt.thingspeak.com"
CHANNEL_ID = "XXXXXXXXXXXXXXXXX"
WRITE_API_KEY = "XXXXXXXXXXXXXXXXXXXXX"
topico = "channels/" + CHANNEL_ID + "/publish/" + WRITE_API_KEY
cliente = MQTTClient("umqtt_client", SERVIDOR)
try:
while True:
dht.measure()
temp = dht.temperature()
umid = dht.humidity()
print('Temperatura: %3.1f °C' %temp)
print('Umidade: %3.1f %%' %umid)
conteudo = "field1=" + str(temp) + "&field2=" + str(umid)
print ('Conectando a ThingSpeak...')
cliente.connect()
cliente.publish(topico, conteudo)
cliente.disconnect()
print ('Envio realizado.')
time.sleep(600.0)
except KeyboardInterrupt:
estacao.disconnect()
estacao.active(False)
print("Fim.")
*****************************************************************************************************
No shell aparece como resposta:
MPY: soft reboot
Iniciando...
Conexao realizada.
('192.168.0.23', '255.255.255.0', '192.168.0.1', '8.8.8.8')
Temperatura: 29.0 °C
Umidade: 63.0 %
Conectando a ThingSpeak...
Traceback (most recent call last):
File "<stdin>", line 38, in <module>
File "umqtt/simple.py", line 67, in connect
OSError: -2
linha 38 é cliente.connect()
The following lines were added to the subplot function in version 2025a (line 291):
if ancestorFigure.Units == "normalized"
waitfor(ancestorFigure,'FigureViewReady',true);
end
That code isn't in version 2024a.
Because of this, I'm experiencing issues that cause the code to stop running when using subplot in this way:
figure('Units','normalized','Position',[0 0 0.3 0.3])
subplot(1,2,1)
...
Has anyone else encountered this error?
Does anyone understand the need for those lines of code?
As far as I can tell, there is still no official support for creating publication-ready tables from regression output, either as latex or natively. Although MATLAB isn't primarily statistical software, this still seems like an oversight, as almost any similar software has this capability built-in or as a package.
昨日 5/29 にお台場で MATLAB EXPO が開催されました。ご参加くださった方々ありがとうございました!
私は AI 関連のデモ展示で解説員としても立っておりましたが、立ち寄ってくださる方が絶えず、ずっと喋り続けてました。また、講演後に「さっきのすごくね?」という会話が漏れ聞こえてきたのがハイライト。
参加されたみなさま、印象に残ったこと・気になった講演・ポスター・デモ・新機能等あったら教えてください!(次回に向けて運営面での感想も)
I want to use Simulink for model-based development of the TC3XX series development board, but I am not sure about the development process and toolchain? Is there a free toolchain available for me to use? Do you have a detailed development tutorial?
以前のEXPOでも参加・聴講したことがある
67%
知り合いから聞いた
0%
MathWorksからのプロモーション,EXPOサイトで知った
0%
今年のEXPO会場でたまたま見かけた
0%
ライトニングトークって何?
33%
3 votos
Due to MATLAB being banned in some mainland Chinese universities in 2020, in recent years a Chinese company called "Suzhou Tongyuan SoftControl" has completely imitated MATLAB’s behavior. Below are some screenshots as evidence. What is your opinion on this issue?
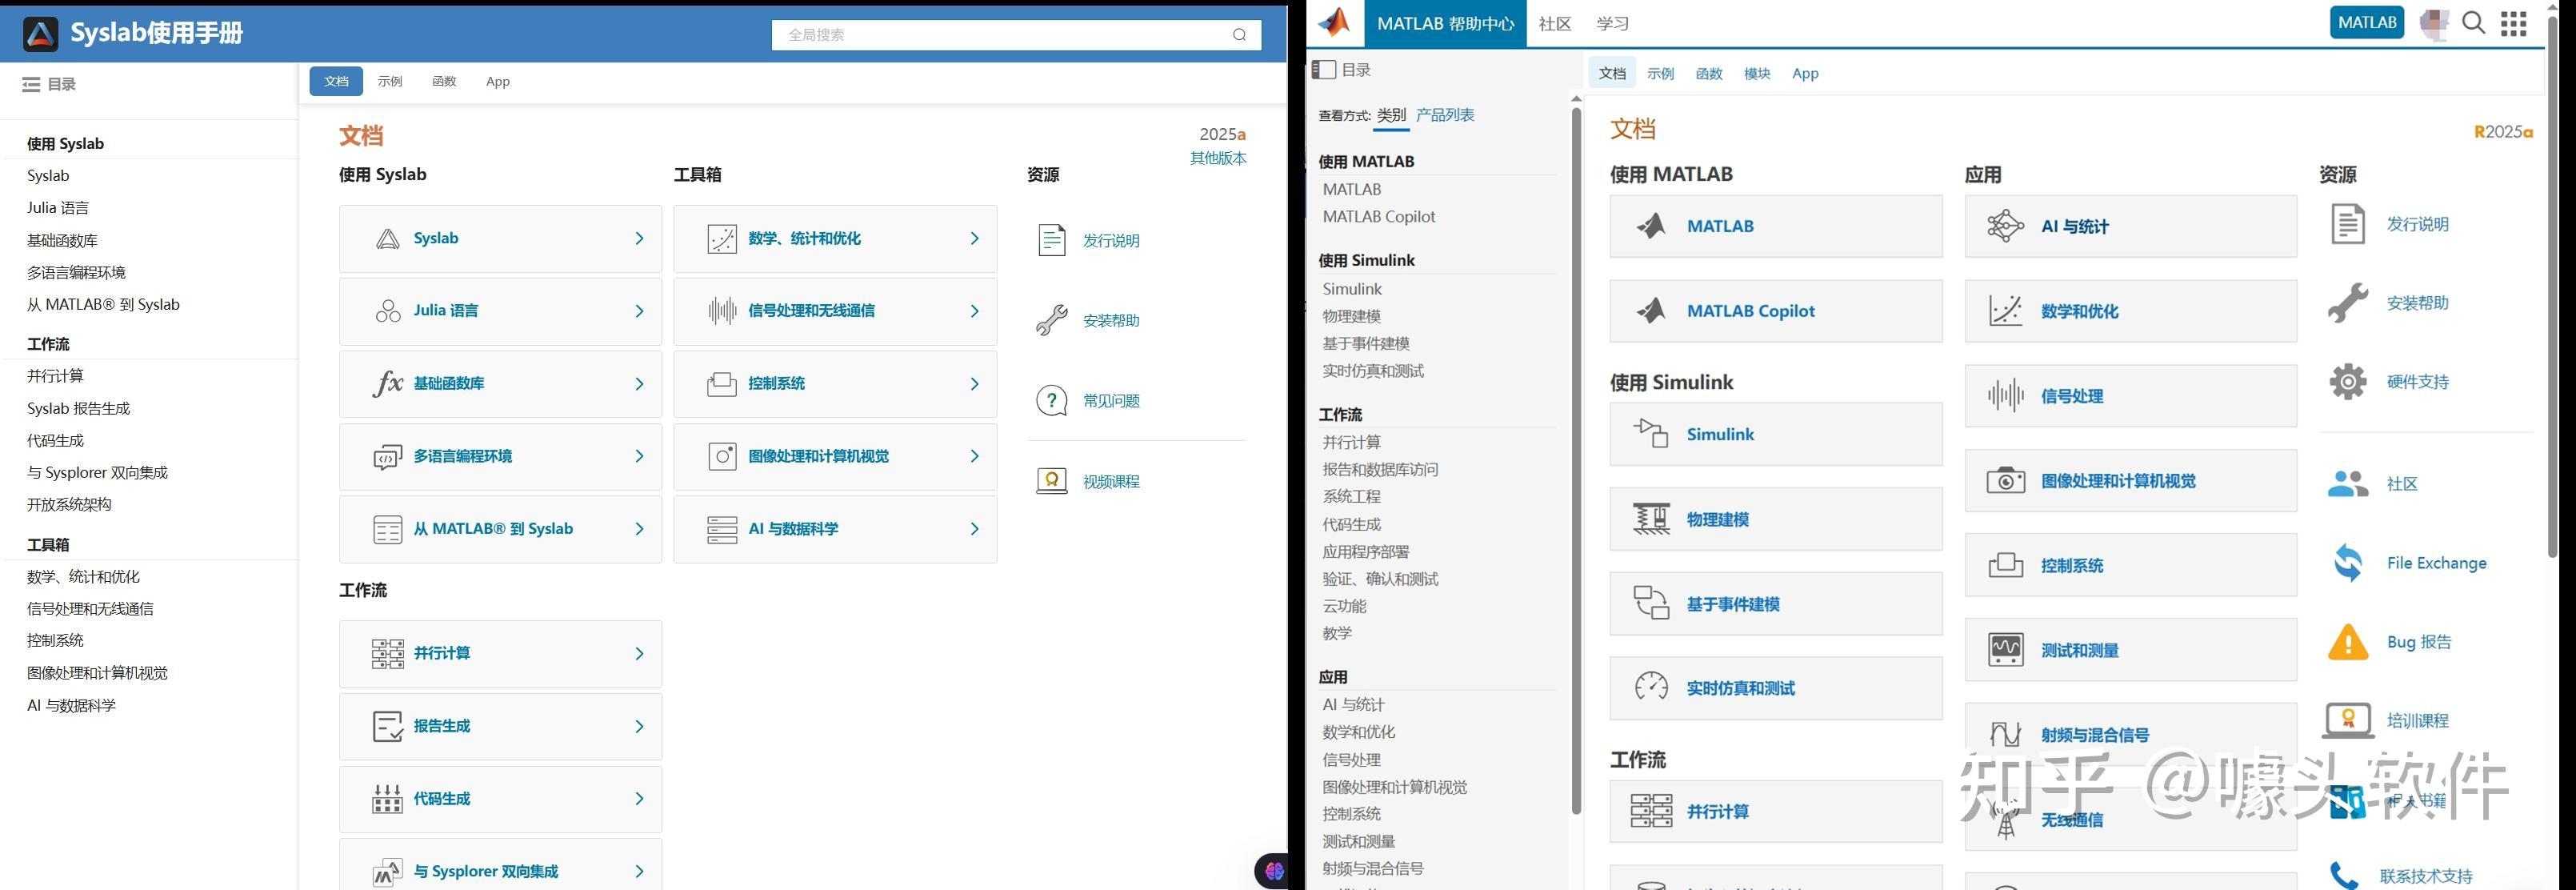
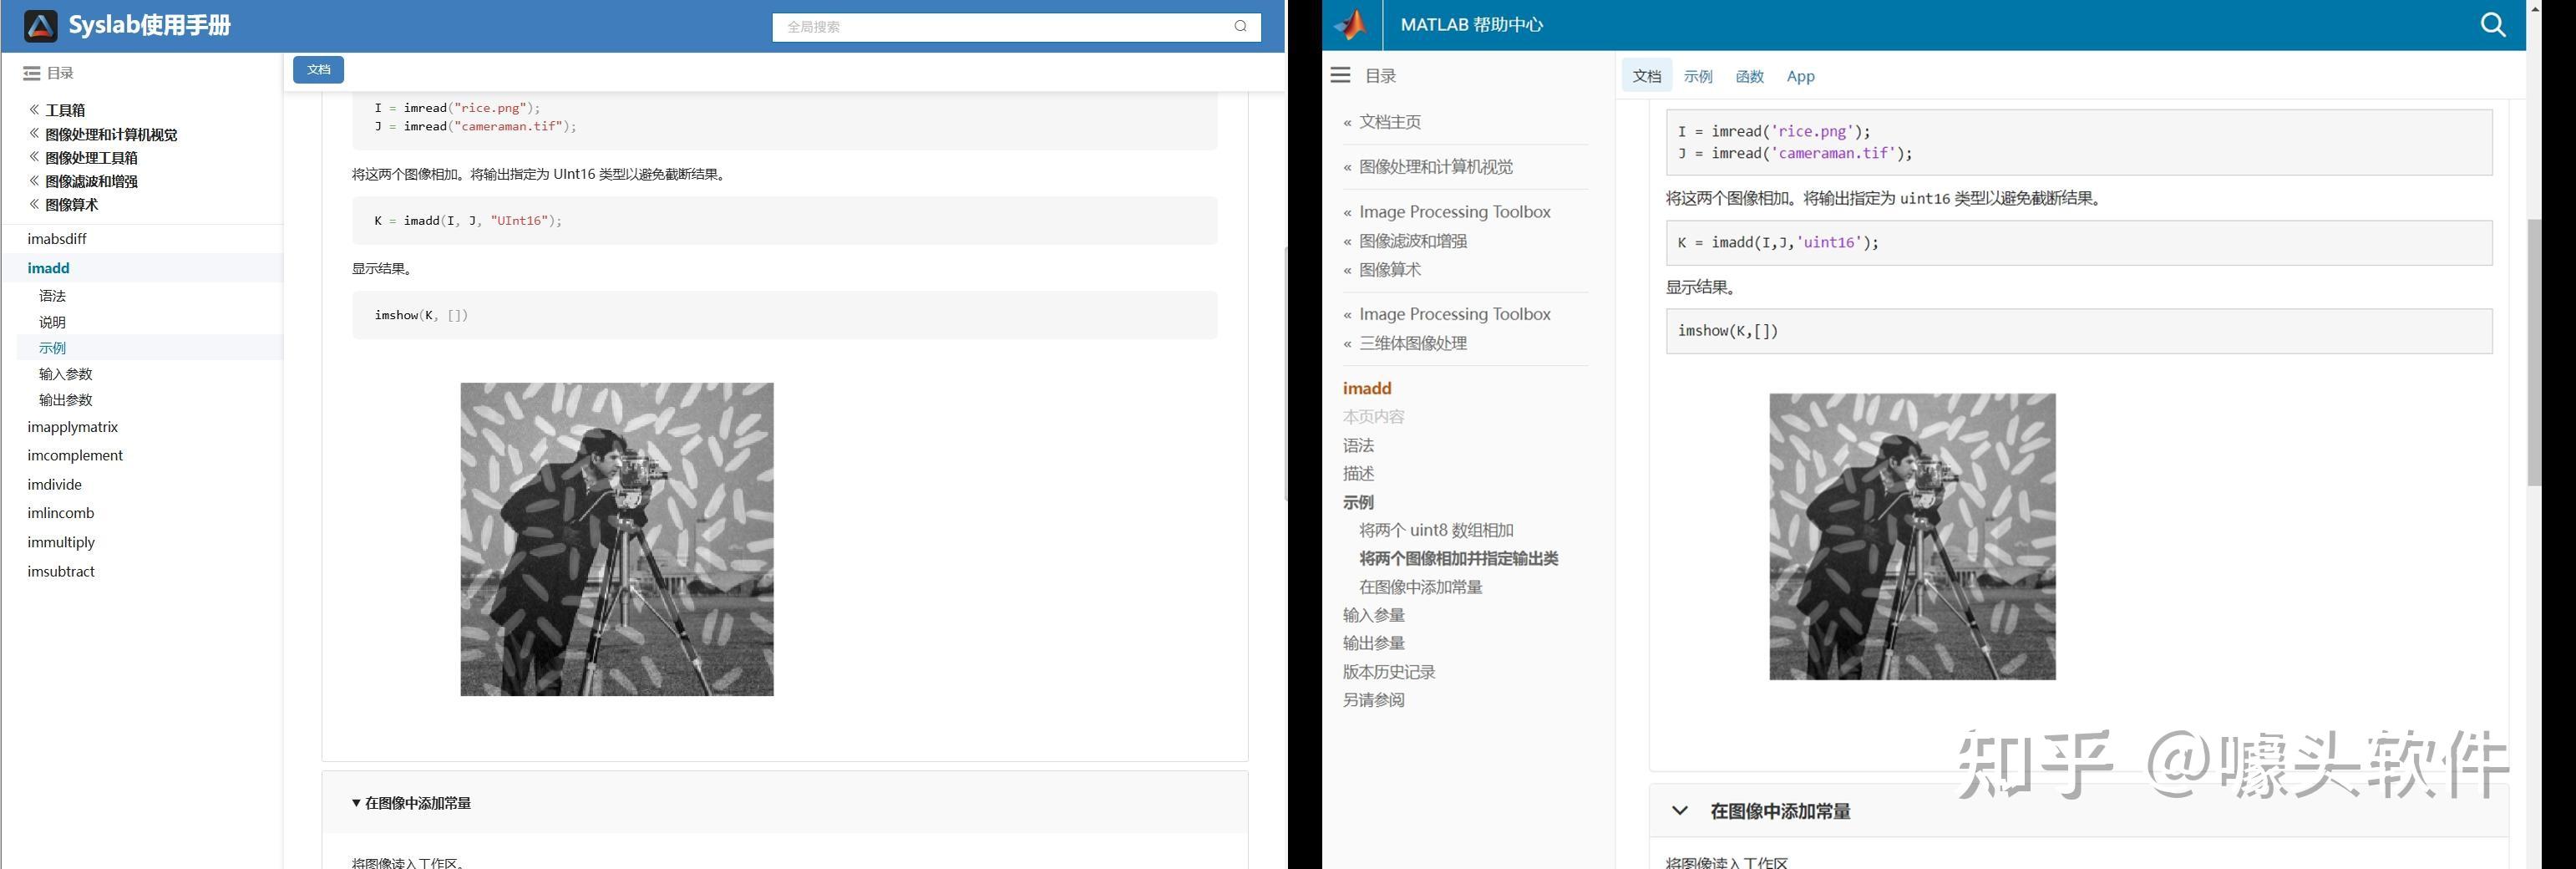
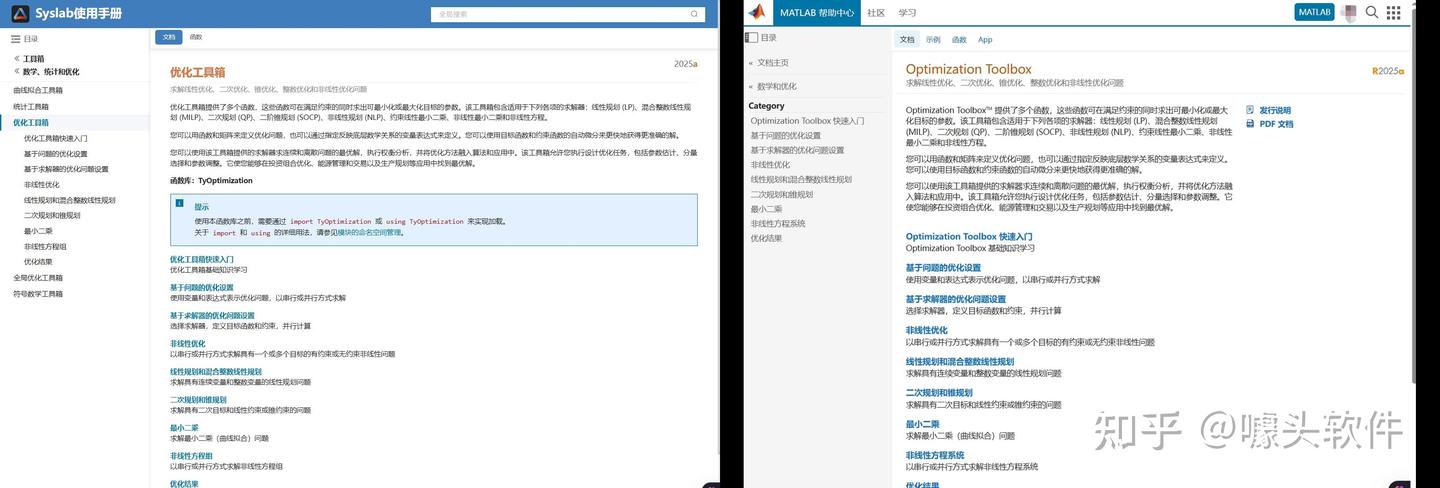
Source: Syslab 帮助文档-苏州同元软控
After waiting for a long time, the MathWorks official Community has finally resumed some of its functionalitys! Congratulations! Next, I’d like to share some thoughts to help prevent such outages from happening again, as they have affected far too many people.
- Almost all resources rely solely on MathWorks servers. Once a failure (or a ransomware attack) occurs, everything is paralyzed, and there isn’t even a temporary backup server? For a big company like MathWorks to have no contingency plan at all is eye-opening. This tells us that we should have our own temporary emergency servers!
- The impact should be minimized. For example, many users need to connect to the official servers to download various support packages, such as the “Deep Learning Toolbox Converter for ONNX Model Format.” Could these be backed up and mirrored to the “releases” section of a GitHub repository, so users in need can download them.
- A large proportion of users who have already installed MATLAB cannot access the online help documentation. Since R2023a, installing the help documentation locally has become optional. This only increases the burden on the servers? Moreover, the official website only hosts documentation for the past five years. That means after 2028, if I haven’t installed the local offline documentation, I won’t be able to access the online documentation for R2023a anymore?
Anything else you’d like to add? Feel free to leave a comment.
Any status updates on the license center and add on tool boxes?
@William Rose, Your dedication to helping others and sharing your knowledge is a big win for the community. Thanks for taking the time to contribute so thoughtfully - your impact is definitely being noticed.👏
Keep it up!
The attached code is an animated solution of the three body problem. On 2024b it runs perfectly fine. When we tried it on 2025a, the animation constantly hitches, the CPU usage is almost double and the runtime is much slower. The curves also look less detailed and jagged in some places. When we run it without drawing anything, the performance seems comparable between versions, but still slightly slower. All of this behavior persists across different hardware. Anybody else having this kind of problem with the new release? I'm suspecting the graphics backend changes may be the culprit here...
clc
clear
close
syms t x1(t) y1(t) x2(t) y2(t) x3(t) y3(t)
G = 6.6743 * 10^-11;
%epsilon = 1e-4
m1 = 10^12;
m2 = 1*10^12;
m3 = 1*10^12;
r1 = [x1(t),y1(t)];
K1 = 1/2 * m1 * (diff(x1(t),t)^2 + diff(y1(t),t)^2);
r2 = [x2(t),y2(t)];
K2 = 1/2 * m2 * (diff(x2(t),t)^2 + diff(y2(t),t)^2);
r3 = [x3(t),y3(t)];
K3 = 1/2 * m3 * (diff(x3(t),t)^2 + diff(y3(t),t)^2);
L1x = diff(diff(K1,diff(x1(t),t)) , t);
L1y = diff(diff(K1,diff(y1(t),t)) , t);
L2x = diff(diff(K2,diff(x2(t),t)) , t);
L2y = diff(diff(K2,diff(y2(t),t)) , t);
L3x = diff(diff(K3,diff(x3(t),t)) , t);
L3y = diff(diff(K3,diff(y3(t),t)) , t);
r12 = r2 - r1;
r13 = r3 - r1;
r23 = r3 - r2;
dlugosc_r12 = sqrt(r12(1)^2 + r12(2)^2);
dlugosc_r13 = sqrt(r13(1)^2 + r13(2)^2);
dlugosc_r23 = sqrt(r23(1)^2 + r23(2)^2);
Q12 = G * m1 * m2 / dlugosc_r12^2 * (r2-r1)/dlugosc_r12;
Q13 = G * m1 * m3 / dlugosc_r13^2 * (r3-r1)/dlugosc_r13;
Q23 = G * m2 * m3 / dlugosc_r23^2 * (r3-r2)/dlugosc_r23;
Q21 = -Q12;
Q32 = -Q23;
Q31 = -Q13;
Q1 = Q12 + Q13;
Q2 = Q21 + Q23;
Q3 = Q31 + Q32;
eqn_1_x = L1x == Q1(1);
eqn_1_y = L1y == Q1(2);
eqn_2_x = L2x == Q2(1);
eqn_2_y = L2y == Q2(2);
eqn_3_x = L3x == Q3(1);
eqn_3_y = L3y == Q3(2);
syms X1 Y1 X2 Y2 X3 Y3
Q1_num = subs(Q1,[x1(t), y1(t), x2(t), y2(t), x3(t), y3(t)],[X1, Y1, X2, Y2, X3, Y3]);
Q2_num = subs(Q2,[x1(t), y1(t), x2(t), y2(t), x3(t), y3(t)],[X1, Y1, X2, Y2, X3, Y3]);
Q3_num = subs(Q3,[x1(t), y1(t), x2(t), y2(t), x3(t), y3(t)],[X1, Y1, X2, Y2, X3, Y3]);
syms vx1 vy1 vx2 vy2 vx3 vy3
state_dot = [
vx1;
vy1;
vx2;
vy2;
vx3;
vy3;
Q1_num(1)/m1;
Q1_num(2)/m1;
Q2_num(1)/m2;
Q2_num(2)/m2;
Q3_num(1)/m3;
Q3_num(2)/m3
];
f = matlabFunction(state_dot, 'Vars', {sym('t'), [X1; Y1; X2; Y2; X3; Y3; vx1; vy1; vx2; vy2; vx3; vy3]});
u0 = [-1e5; %x1
0; %y1
1e5; %x2
0; %y2
0; %x3
sqrt(3)*1e5; %y3
-11/2 * 1e-3; %vx1
11/2*sqrt(3)*1e-3; %vy1
-11/2 * 1e-3; %vx2
-11/2*sqrt(3)*1e-3; %vy2
11e-3; %vx3
0]; %vy3
tspan = [0, 1e9];
%options = odeset('RelTol', 1e-15, 'AbsTol', 1e-20);
[t_sol, u_sol] = ode45(f, tspan, u0);
t_anim = linspace(t_sol(1), t_sol(end), 5000);
u_anim = interp1(t_sol, u_sol, t_anim);
%%
% figure;
tor_1 = plot(u_anim(:,1), u_anim(:,2), 'r', 'LineWidth',1.5); hold on;
tor_2 = plot(u_anim(:,3), u_anim(:,4), 'g', 'LineWidth',1.5);
tor_3 = plot(u_anim(:,5), u_anim(:,6), 'b', 'LineWidth',1.5);
% xlabel('x [m]');
% ylabel('y [m]');
% legend('Ciało 1', 'Ciało 2', 'Ciało 3');
% title('Trajektorie ciał w układzie trzech ciał');
% axis equal
% grid on;
pozycja_1 = plot(u_anim(1,1),u_anim(1,2),'ro','markersize',10,'markerface','r'); hold on
pozycja_2 = plot(u_anim(1,3),u_anim(1,4),'go','markersize',10,'markerface','g');
pozycja_3 = plot(u_anim(1,5),u_anim(1,6),'bo','markersize',10,'markerface','b');
% xlim([-2e5,2e5])
% ylim([-2e5,2e5])
axis equal
for i = 1 : 1 : length(t_sol)
set(pozycja_1,'XData', u_anim(i,1),'YData', u_anim(i,2));
set(pozycja_2,'XData', u_anim(i,3),'YData', u_anim(i,4));
set(pozycja_3,'XData', u_anim(i,5),'YData', u_anim(i,6));
set(tor_1,'XData', u_anim(1:i,1),'YData', u_anim(1:i,2));
set(tor_2,'XData', u_anim(1:i,3),'YData', u_anim(1:i,4));
set(tor_3,'XData', u_anim(1:i,5),'YData', u_anim(1:i,6));
drawnow;
% pause(0.001);
end
I have a pressure vs. time plot resulting from the input of an elastic wave, which I obtained from an Abaqus simulation. So, I have access to all the data. Now, I want to convert this time-domain graph into a frequency-domain graph using FFT in MATLAB.
I came across a code through ChatGPT, but I’m not fully confident in relying on it. Could anyone kindly clarify whether the formulas used for FFT in MATLAB are universal for all types of signals? Or is there a more effective and reliable method I should consider for this purpose?
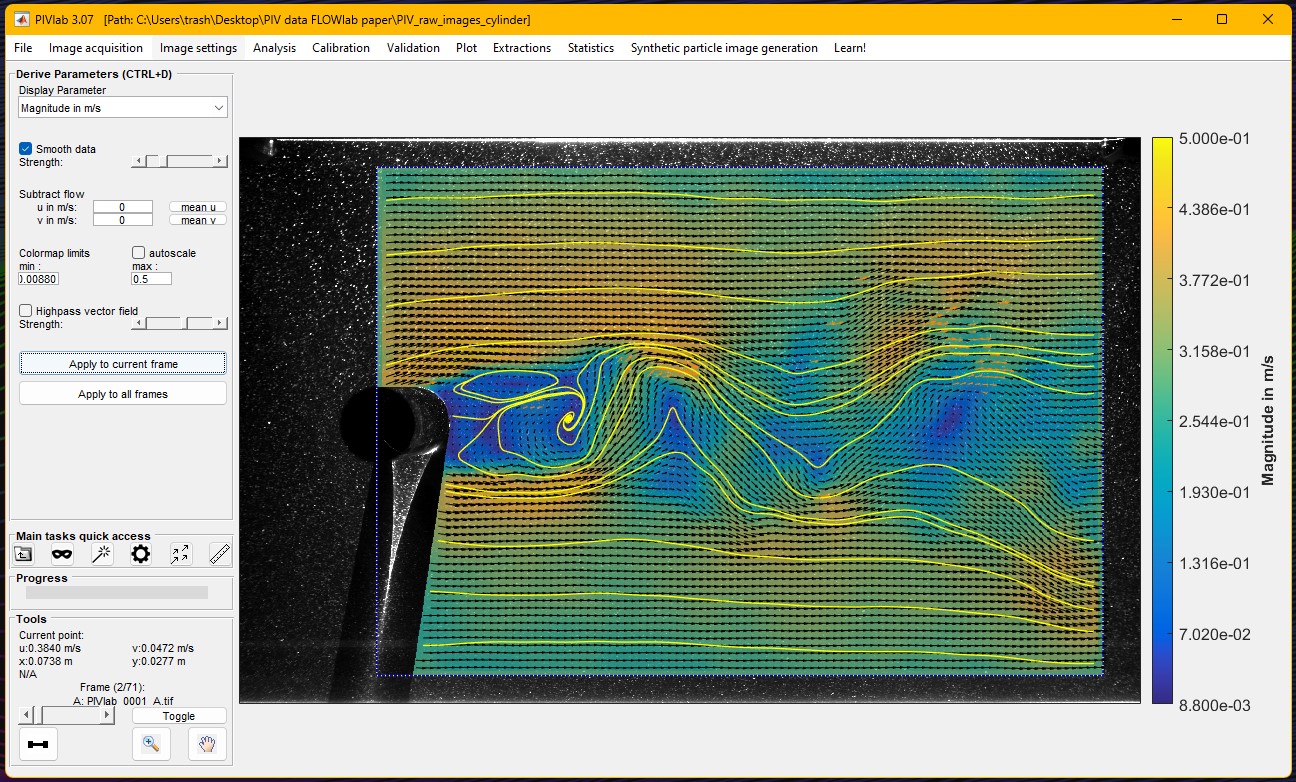
During the past twelve months, PIVlab, a MATLAB Community Toolbox for particle interference velocimetry (a technique for fluid flow measurement) set a new record for all-time File Exchange downloads, surpassing one hundred thousand, dating back to 2010. It also recently eclipsed the 1000 downloads/month mark on File Exchange.
Congratulations to @William Thielicke and his team for this fantastic long term achievement and head over to the File Exchange to download and use it: PIVlab - particle image velocimetry (PIV) tool with GUI - File Exchange - MATLAB Central
Hi guys!
Im doing a project where i need to simulate a ship connected to the grid. I have a grid->converter AC-DC-AC -> dynamic load. My converter has to keep the voltage consistent and what changes is the current. Can somebody help me?
Why is RoBERTa not available as a pretrained model? It is superior to BERT in many fields and has become more popular in the literature. For faster inference, you should offer DistilBERT, which is more modern than BERT but smaller/faster. The respository hasn't been updated in two years, which is a lifetime in the field of deep learning.
https://github.com/matlab-deep-learning/transformer-models
Hi,
We are looking for users of Simulink who also work with the Vehicle Network toolbox to attend a usability session. This wil be a 2 hour session and will offer $100 compensation.
If you are interested, please answer the questions below and send them to: usabilityrecruiting@mathworks.com
In the past 2 years, how often have you worked with ARXML (AUTOSAR XML) files in vehicle network communication?
a. At least 3-5 days per week
b. Once or twice a week
c. A few times a month
d. Once a month or less
e. Never
-
3. Have you worked with automotive ethernet in the past?
a. Yes
b. No
-
4. Which of the following best describe your experience with Simulink? (select all that apply)
Study Screener Q4
a. I have used CAN/ CAN FD blocks (https://www.mathworks.com/help/vnt/can-simulink-communication.html)
b. I have used Simulink Buses
c. I have used Simulink Data Dictionaries
d. Other
-
Thank you!
Elaine
If you are interested in this session, just send an email with the answers to the following questions to usabilityrecruiting@mathworks.com
1. Which of the following best describes your experience with Design of Experiment (DOE)?
a. I regularly use DOE in my work and am comfortable designing experiments and analyzing results
b. I have used DOE in a few projects and understand its principles and applications
c. I have a basic understanding of DOE concepts but have limited practical experience
d. I have never used DOE but I’m interested in learning
-
2. Briefly describe one of your recent projects where you used/want to use DOE. What are the objectives and outcomes?
-
Thank you!