Resultados de
To solve the puzzle, first unscramble each of the words on the left. Then rearrange the letters in the yellow shaded boxes to complete the sentence on the right.
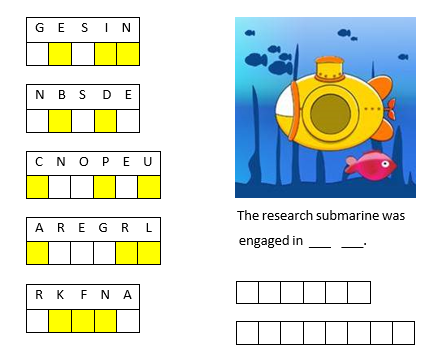
If you enjoyed this puzzle let me know with a like or in the comments below and I'll post more of them. Please don't post your answer, or any hints, and spoil it for those who come across this puzzle after you!! If you want to check your answer, you can messge me your guess through the link on my profile card (click on my name, Rena Berman, above and then on the envelope icon in the top right corner of the profile card that appears).
I wanted to write to my public channel 2278931 with 8 different values to 8 different gauge widgets.
Here is my link.
https://api.thingspeak.com/update.json?api_key=xxxxxxxxxxxxxxxx&field1=1&field2=2&field3=3&field4=4&field5=5&field6=6&field7=7&field8=8
You can change values and in the link to change gauge values. On edit I edited my write key to make it not work for others but it will work with your own key.
Hi All,
I'm attempting to put a set of simbiology global sensitivity analysis plots into my thesis and I'm running into some issues with the GSA plots. Firstly, the figures are very large, it would be quite beneficial to grab a set of the plots and arrange them myself, is there any documentation on how to mess around with the '1x1 Sobol' produced by sbiosobol? Or just GSA plots in general.
The second problem is that the results appear to be relative to the most sensitive parameter in that run. Is it recommended to have a resonably sensitive 'baseline' parameter in each run? I find it difficult to compare plots when a not so sensitive parameter is being recorded as near '1' for the whole run because it's being stacked against a set of very insensitive parameters. I.e. if i have multiple sets of GSAs due to a large model, how can I easily compare results? If I could do some single run through with every parameter that would be the ideal, I imagine, but then the default plot would be half a mile off the bottom of my screen, haha! Perhaps there is a solution to the first question that might help there?
Thank you for your help,
Dan
Up until a few weeks ago, there was a "channels shared with me" option in Thingspeak. I was able to access the channel created by a different user, only once. The next time me and my groupmate tried to open the channel, there wasn't a "channels shared with me" option anymore. Why is that and how can this be resolved?
Is there any problem from thingspeak side, from last month my data is not uploading
Currently, I am trying to setup MATLAB and Simulink to connect with Unity. But I have some questions about the installation of ROS on my computer and ROS Toolbox. I found that there are several ROS installations, so, could you please kindly help and support? Hoping that your support will help a lot to my master's thesis.
i want make web site for pre registation to the vachile in thish project i can not thinke how to register in port and how to make .....????
i want make uniqe project
Hi! Actually I'm trying to store data from 5 sensors on the ThingSpeak cloud. I was able to do it 2-3 days back, but right now I'm trying to do the same for last 2-3 hours and it's just not happening. There's nothing wrong with the code because it's getting compiled properly. I'm using
ThingSpeak.writeFields(2261556,"xxxxxxxxxxxxxxxx");
I tried printing its value after storing in a temporary variable........The value comes out to be -301. Is there any fix for this? I need it urgently for a project.
I hope to receive some help soon. Thanks!
% Sample data from channels
channel1Data = 2226948; % Your data for channel 1
% Threshold values for each alert level
threshold1 = 100;
threshold2 = 200;
threshold3 = 300;
% Initialize alert level to 0 (no alert)
alertLevel = 0;
% Check thresholds and determine alert level
if channel1Data >= threshold1 && channel1Data <= threshold2
alertLevel = 1; % Yellow Alert
elseif channel1Data >= threshold2 && channel1Data <= threshold3
alertLevel = 2; % Orange Alert
elseif channel1Data >= threshold3
alertLevel = 3; % Red Alert
end
% Define alert message based on alert level
if alertLevel == 1
alertMessage = 'Threshold exceeded for channel 1!';
elseif alertLevel == 2
alertMessage = 'Threshold exceeded for channel 2!';
elseif alertLevel == 3
alertMessage = 'Threshold exceeded for channel 3!';
else
alertMessage = 'No alert for channel 1.';
end
% Call SMS integration function with the alert message
sendMessage('+639319217695', alertMessage);
function sendMessage(number, message)
% Replace with your SMS service API endpoint and API key
apiUrl = 'https://api.semaphore.co/api/v4/messages';
apiKey = '-----';
% Compose the message payload
payload = struct('apikey', apiKey, 'number', number, 'message', message);
try
% Send the SMS using the SMS service API
response = webwrite(apiUrl, payload);
% Process the response as needed
disp('SMS sent successfully');
catch
disp('Error sending SMS');
end
end
I've just bought a rain gauge with esp 32 but the problem is Its code is already programmed on esphome
Now I need to send the data to one of my channels so I can perform the logic for my sms API
Tell me if it's possible
Hi all,
I've translated a model from another piece of software (monolix) into simbio programmatically to make use of your very easy global sensitivity analysis system.
It looks a little something like this, for a 'single' line example:
r1 = addreaction(model,'InsI -> InsP');
r1.ReactionRate = 'InsI*kip/vi'; %- is + panc
k1 = addkineticlaw(r1, 'Unknown');
Multiplied about 20 fold, as you can see I have included my volumes within the reaction rates myself (vi). The model functions perfectly and I have corrected the outputs at the end:
[time, x, names] = sbiosimulate(model,csObj,dObj1);
x(:,1) = x(:,1)/vi;
So that they are in concentration, as needed. However, when it comes to sensitivity analysis because I have corrected them post-model it is technically incorrect, it is analysing the absolute quantities. This is quite noticible in the sensitivity to the volumes.
Is there an easy fix to this, I've had to fight dimensionality with units in the past using simbio and I'd be great if there was some way of dividing a compartment output by a volume, for example. It is a functionality that exists in monolix, so I was hopeful it might here!
Thank you for your time.
EDIT:
I think I've worked it out, I had to refactor my model to operate in concentrations, just refitting it now. Now I should just be able to use unitless compartments.
Hi
We are using Raspberry Pi to send some sensor data to Thingspeak. Is it possible to send this data to any other IoT hub service lets say Thingsboard, AWS or Azure IoT hub? Does Thingspeak provide any kind of API which can give us alerts whenever the data is received in Thingspeak server ?
Thanks
I was unable to update fields during this time and was also unable to login to thingspeak.com.
Hi, is the timecontrol in matlab stop running around 1500 UTC+8 230809?
I am trying to make a simulink model to use a MPC to reduce power consumption of HVAC system in an electric vehicle during cool down from ambient temperature to a set point temperature. Any help regarding this would be appreciated
Hi I'm a newbie, the data I'm sending from the weather station I'm trying hasn't reached me for about 1 week.
Or rather, the data is sent regularly from the station to Thingspeak which connects and sends, but looking on the site it seems that they are not received.
The latest data received, in fact, dates back to 7 days ago.
By chance, after sending the 8000 available data, does the service stop?
Hi
I am a beginner in MATLAB. I am trying to stimulate RF energy harvesting. Is it possble to stimulate this using simulink? Kindly help me. Thank You.
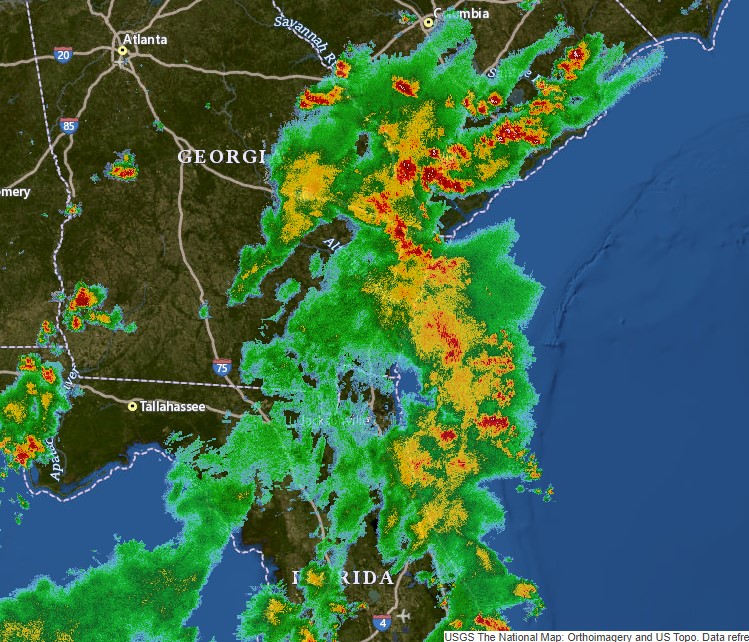
im trying to draw a path for the aircraft. so the aircraft needs to avoid all the red zones in the radar image i have and should travel only on green zones even the waypoints are on redzones.
% Load the radar image
radar_image = imread('radar.jpg');
I = radar_image;
% Display the radar image
figure;
imshow(I);
% Select waypoints
disp('Select the waypoints:');
[x, y] = ginput;
waypoints = [x, y];
% Save waypoints
save('waypoints.mat', 'waypoints');
% Load saved waypoints
load('waypoints.mat');
% Plot waypoints and connect them with lines
hold on;
plot(waypoints(:, 1), waypoints(:, 2), 'ro', 'LineWidth', 2);
plot(waypoints(:, 1), waypoints(:, 2), 'r--', 'LineWidth', 1);
% Load aircraft icon image
aircraft_icon = imread('aircraft_icon.png');
% Resize the aircraft icon image
desired_size = 30; % Change this value to adjust the size of the aircraft icon
aircraft_icon_resized = imresize(aircraft_icon, [desired_size, desired_size]);
% Animate aircraft using AI algorithm
tolerance = 5; % Tolerance for reaching waypoints
max_steps = 100; % Maximum steps to reach the destination
step_size = 1; % Step size for potential field calculations
% Plot the initial position of the aircraft
current_pos = waypoints(1, :);
h = image(current_pos(1), current_pos(2), aircraft_icon_resized);
set(h, 'AlphaData', 0.7); % Set the transparency (optional)
for i = 1:size(waypoints, 1)-1
start = waypoints(i, :);
finish = waypoints(i+1, :);
% Perform A* algorithm to find an alternate path through green zones
alternate_path = A_star(start, finish);
for j = 1:size(alternate_path, 1)-1
% Initialize the position of the aircraft
current_pos = alternate_path(j, :);
next_waypoint = alternate_path(j+1, :);
% Continue to the next waypoint if the current position is already near the waypoint
if norm(current_pos - next_waypoint) <= tolerance
continue;
end
% Perform animation to move the aircraft through the potential field
animateAircraft(current_pos, next_waypoint, max_steps, step_size, h);
% Update the radar image I with the current position of the aircraft
I(round(current_pos(2)), round(current_pos(1))) = 0;
end
end
function animateAircraft(current_pos, next_waypoint, max_steps, step_size, h)
% Animate the aircraft to move from current_pos to next_waypoint
for t = 1:max_steps
% Check if the aircraft has reached the destination waypoint
if norm(current_pos - next_waypoint) <= tolerance
break;
end
% Calculate potential field forces
attractive_force = next_waypoint - current_pos;
repulsive_force = zeros(1, 2);
% Calculate the repulsive forces from each red and yellow region
red_regions = find(I == 1);
yellow_regions = find(I == 2);
for k = 1:length(red_regions)
[r, c] = ind2sub(size(I), red_regions(k));
obstacle = [c, r];
repulsive_force = repulsive_force + calculate_repulsive_force(current_pos, obstacle);
end
for k = 1:length(yellow_regions)
[r, c] = ind2sub(size(I), yellow_regions(k));
obstacle = [c, r];
repulsive_force = repulsive_force + calculate_repulsive_force(current_pos, obstacle);
end
% Combine the forces to get the total force
total_force = attractive_force + 0.5 * repulsive_force; % Reduce repulsive force to move through obstacles more easily
% Normalize the total force and move the aircraft
total_force = total_force / norm(total_force);
current_pos = current_pos + step_size * total_force;
% Update the aircraft position on the plot
set(h, 'XData', current_pos(1), 'YData', current_pos(2));
drawnow; % Force the plot to update
% Pause for a short duration to visualize the animation
pause(0.05);
end
end
function force = calculate_repulsive_force(position, obstacle, I)
% Constants for the potential field calculation
repulsive_gain = 1000; % Adjust this value to control the obstacle avoidance strength
min_distance = 5; % Minimum distance to avoid division by zero
% Calculate the distance and direction to the obstacle
distance = norm(position - obstacle);
direction = (position - obstacle) / distance;
% Check if the obstacle is a waypoint
is_waypoint = false;
waypoints = [1, 2; 3, 4; 5, 6]; % Replace this with the actual waypoints' coordinates
for i = 1:size(waypoints, 1)
if isequal(obstacle, waypoints(i, :))
is_waypoint = true;
break;
end
end
% Check the color of the obstacle in the radar image
color = I(round(obstacle(2)), round(obstacle(1)));
% Calculate the repulsive force
if ~is_waypoint && color ~= 0 % Obstacle is not a waypoint or 0
force = repulsive_gain / max(distance, min_distance)^2 * direction;
else
force = zeros(1, 2);
end
end
this the code im using. But according to the output im getting, the aircraft is still travelling through all the red and yellow zones.i have tagged the aircraft_icon.png and rada.jpg images which have been used in the code. can somebody help me out with this?

I am able to modify the chart setting to display the average data with a timescale of 30 minutes. However, when I export the csv file, it shows the reading of 15 seconds. How should I export the average per 30 minutes?